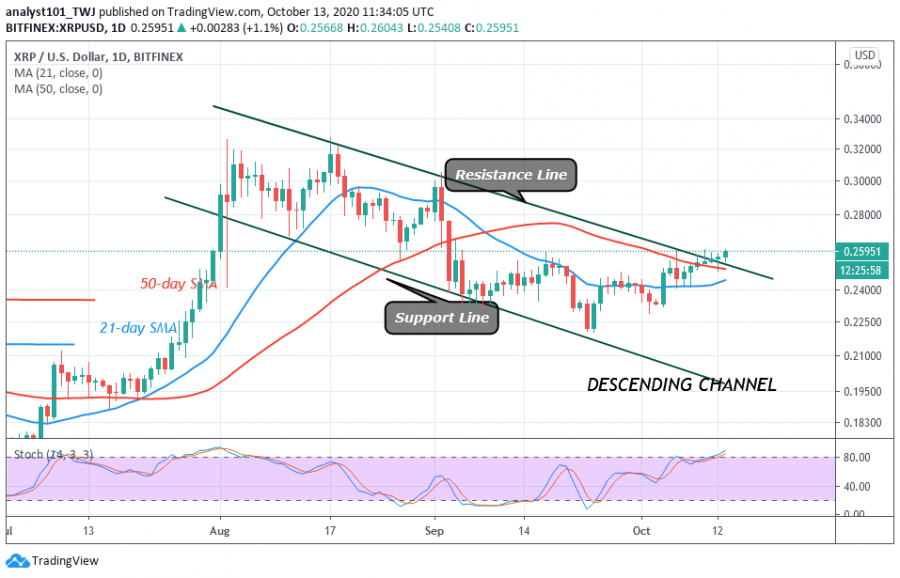
Today, Ripple hit a $0.26 high as the price dropped to a $0.254 low. The price has retested the overhead resistance on more than four occasions.
These fluctuations have been ongoing since October 5. Buyers have been unrelenting as they made several attempts to break the $0.26 overhead resistance. For the past week, Ripple has been range-bound between $0.245 and $0.26.
Each time, buyers fail to break above the overhead resistance; XRP will fall to either $0.245 or $0.25. This has been the market scenario in the last few days. Certainly, XRP will either face a breakout or breakdown in a couple of days to come. For example, a breakout above the overhead resistance will push XRP to rise to $0.30 high. Conversely, a breakdown will further make the coin to decline to $0.228 or $0.22 low. The coin is trading at $0.259 at the time of writing.
Ripple indicator analysis
Ripple is now trading in the bullish trend zone. The price has broken above the SMAs and the resistance line of the descending channel. This enables the coin to rise but it is facing strong rejection at the $0.26 price level. XRP is trading above 80% range of the daily stochastic. The coin is in the overbought region and it may decline at any time.

Key Resistance Zones: $0.35, $0.40, $0.45
Key Support Zones: $0.25, $0.20, $0.15
What is the next move for Ripple?
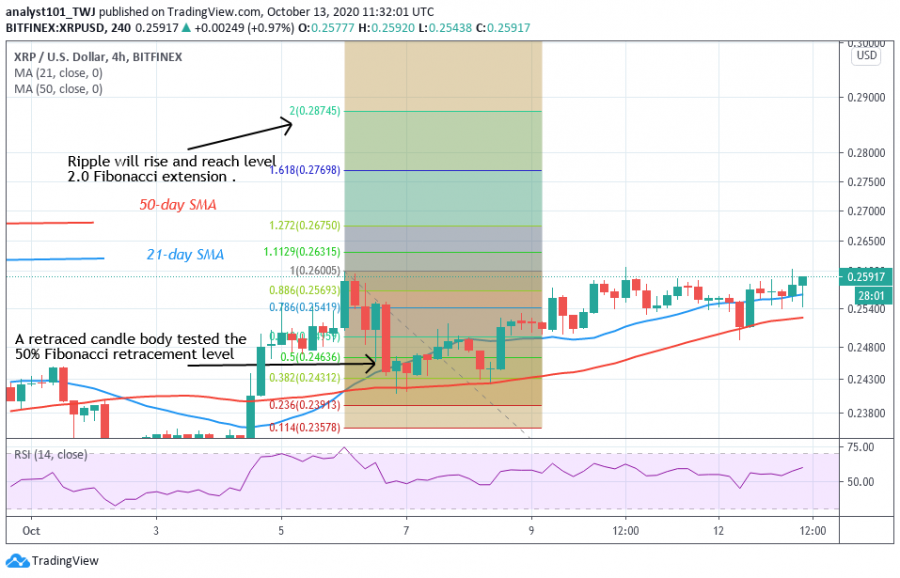
The Fibonacci tool has indicated an upward movement of the coin. The breaking of the $0.26 support is expected for the bullish scenario to take effect. The retraced red candle body tested the 50% Fibonacci retracement level. This explains that XRP will rise and reach level 2.0 Fibonacci extension. That is a high of $0.287.

Disclaimer. This analysis and forecast are the personal opinions of the author that are not a recommendation to buy or sell cryptocurrency and should not be viewed as an endorsement by CoinIdol. Readers should do their own research before investing funds.
