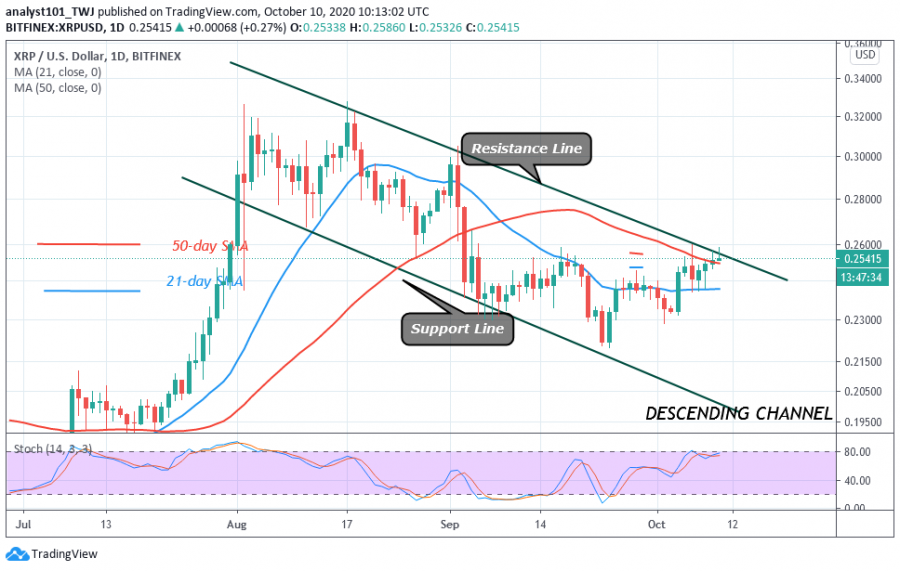
Following a rebound above $0.23 support, Ripple’s price has continued to fluctuate between $0.24 and $0.26 since October 5.
Today, XRP has fallen to $0.2509 at the time of writing. Initially, the coin has risen to $0.257 before it was repelled. About three days ago, buyers pushed XRP to the $0.26 resistance zone but were repelled.
The bearish reaction catapulted the coin to reach a low of $0.242. This has been the price scenario for the past week. The bottom line is that if buyers push the price above $0.26 support and the momentum is sustained, the crypto will be in the bullish trend zone. Ripple will be out of the downward correction. Expectantly, there will be a sudden rise in price movement on the upside. Ripple is expected to hit the price at $0.30 high.
Ripple indicator analysis
Ripple price is at the point of breaking above the SMAs. A break above the moving averages will accelerate price movement on the upside. The upward movement will be interrupted if price fails to break above the EMAs. The crypto is above the 70% range of the daily stochastic indicating that the coin is in a bullish movement.

Key Resistance Zones: $0.35, $0.40, $0.45
Key Support Zones: $0.25, $0.20, $0.15
What is the next move for Ripple?
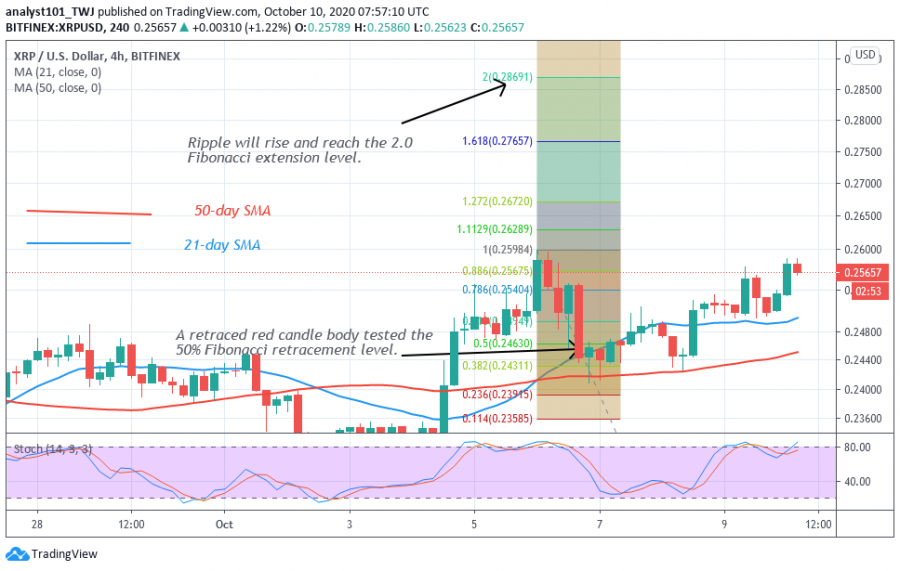
There is a possibility of Ripple upward move, once the resistance at $0.26 is breached. On October 6 uptrend, Ripple was resisted as price reached a high of $0.26. The retraced red candle body tested the 50% Fibonacci retracement level. This gives the clue that XRP will rise and reach level 2.0 Fibonacci extension. That is, a high of $0.286.

Disclaimer. This analysis and forecast are the personal opinions of the author that are not a recommendation to buy or sell cryptocurrency and should not be viewed as an endorsement by CoinIdol. Readers should do their own research before investing funds.
