As the world’s largest and most dominant cryptocurrency, Bitcoin obviously shares high correlation stats with many of the market’s altcoins. However, while this may be the case, such a correlation isn’t always consistent or even uniform. The same was evidenced when looking at the price charts for Monero, Synthetix, and Crypto.com Coin, with each of these alts reacting differently to the king coin’s market movements.
Monero [XMR]
Source: XMR/USD on TradingView
The price movements of Monero, the crypto-market’s foremost privacy coin, have been very contrary to the movements of most of the industry’s altcoins. While most alts have been on a downtrend since mid-August, Monero has been on an uptrend, with the crypto climbing sharply over the course of September and October. In fact, right before the aforementioned Bitcoin pump, XMR seemed to be trading sideways. However, that didn’t last long as soon, Monero was surging again.
At the time of writing, Monero seemed to have reclaimed its uptrend, with XMR having recorded gains of over 6% over the past week. Further, while the Parabolic SAR’s dotted markers were well below the price candles and pointed to a bullish market, the Awesome Oscillator pictured positive momentum returning to the market.
The privacy coin was in the news a few weeks ago after Chainalysis won a contract to provide the IRS with tools to break Monero’s protocols.
Synthetix Network Token [SNX]

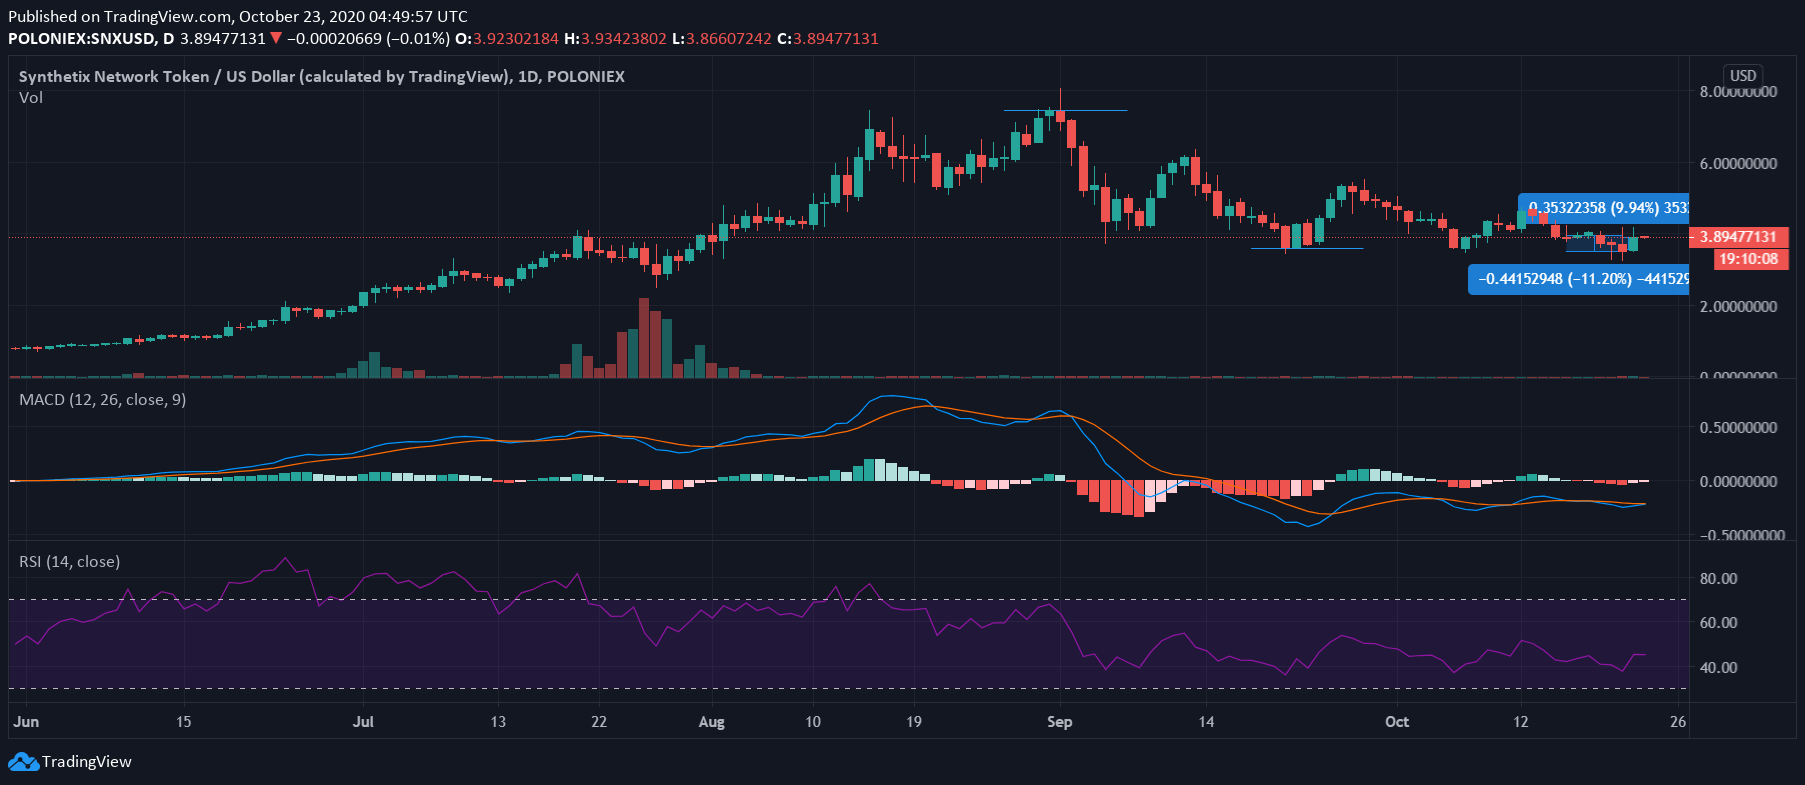
Source: SNX/USD on TradingView
Compared to Monero and Crypto.com Coin, Synthetix’s movements were very much in line with the movements recorded by most of the market’s altcoins. Like these alts, SNX too has fallen since mid-August, with the token’s value losing steam as the DeFi craze ground to a halt. While Bitcoin’s recent hike did push SNX up the charts by 9%, the uptick came on the back of the cryptocurrency falling by 11%, all within a one-week period.
It should be noted, however, that having breached its immediate support level only recently, SNX was still in danger of doing the same again.
Synthetix’s technical indicators were largely ambivalent as while the MACD line and Signal line were closely intertwined, the Relative Strength Index was holding firm right between the oversold and overbought zones.
Crypto.com Coin [CRO]

Source: CRO/USD on TradingView
Like most altcoins in the market, Crypto.com Coin has been on a downtrend for the past 4-5 weeks. However, while these alts noted significant gains as Bitcoin hiked, Crypto.com Coin did not, with CRO continuing to fall on the charts dramatically. In fact, at the time of writing, CRO had fallen by over 37% over a 7-day period.
Further, it seemed that CRO would continue to fall on the charts as the mouth of the Bollinger Bands was very wide around CRO’s price candles. Finally, the Chaikin Money Flow had plunged below zero sharply, a sign of greater capital outflows.
It can be speculated that CRO’s recent performance is a reflection of OKB’s own performance over the period. OKEx’s native token fell on the charts on the back of the exchange suspending withdrawals on the 16th. According to Arca’s Jeff Dorman, exchange tokens might just share a correlation with each other.
