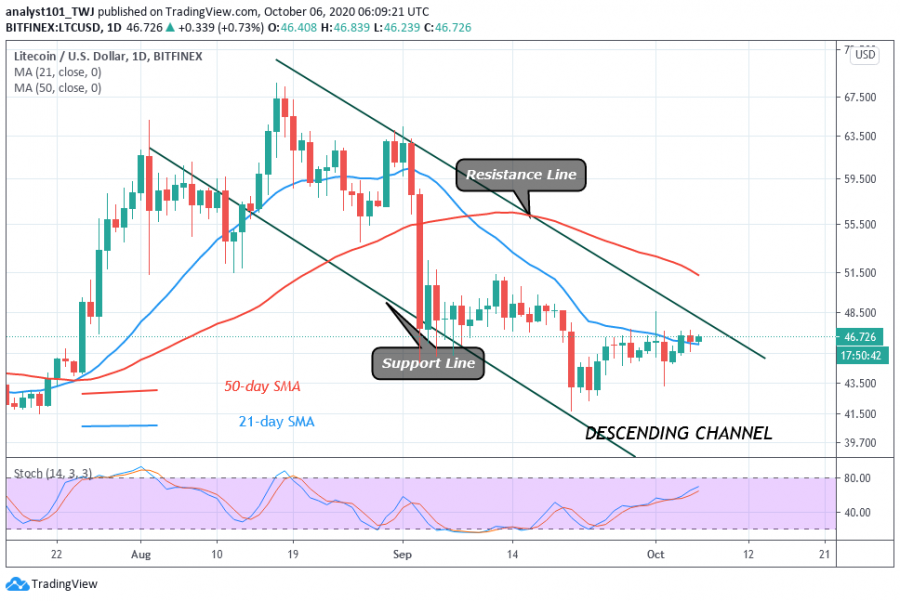
Following its recovery above $39 low, Litecoin rebounded to reach the $47 high. The upward move has been hindered at the $48 resistance zone.
The coin is in a sideways move between $45 and $48 in the last 48 hours. On the upside, a strong bounce above $46 will propel price to break the resistance at $48 and $51.
Litecoin will be trading in the bull market if the bulls are successful. The coin is likely to have upward price acceleration above the $51 support. This will catapult the coin to reach a high of $63. However, if the bulls fail to clear the resistance levels, the price fluctuations will continue in the current price range. Otherwise, another breakdown will compel the coin to reach a low of $41.
Litecoin Indicator Analysis
Litecoin moving averages are sloping southward indicating that the coin is in a bearish trend. The price is below the SMAs indicating that the coin is capable of falling. The stochastic is contrary to other indicators as it is indicating a bullish momentum above the 60% range.

Key Resistance levels: $80, $100, $120
Key Support levels: $50, $40, $20
What Is the Next Move for Litecoin?
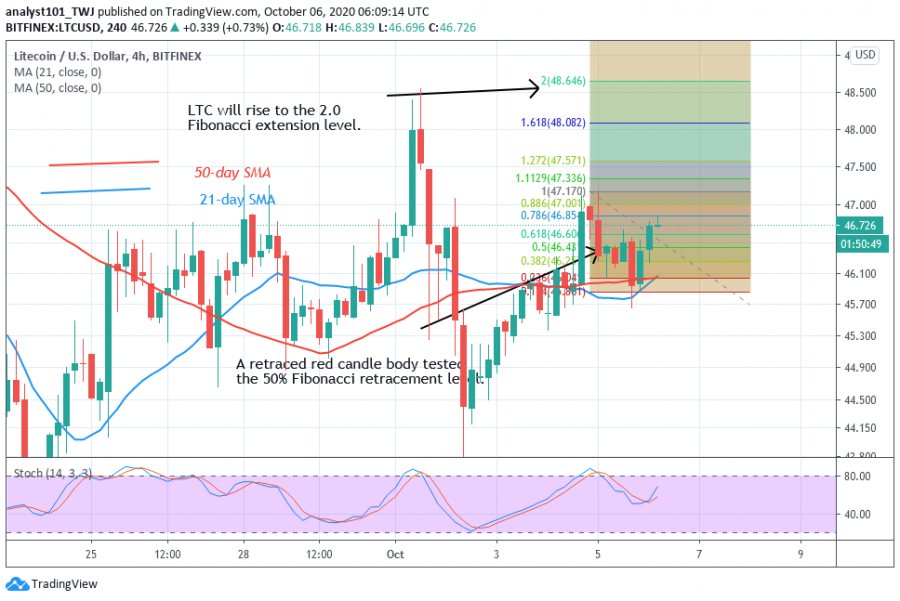
From the price action, buyers are making positive moves to break into the previous highs. The uptrend is facing initial resistance. However, on October 4 uptrend, the coin was resisted and the retraced candle body tested the 50% Fibonacci retracement level. This indicates that the coin will rise and reach the 2.0 Fibonacci extension level or $48.64 high.

Disclaimer. This analysis and forecast are the personal opinions of the author are not a recommendation to buy or sell cryptocurrency and should not be viewed as an endorsement by CoinIdol. Readers should do their own research before investing funds.
