- Tezos seems to be showing signs of a reversal on the daily chart.
- Monero could be close to the top, indicating a potential reversal is coming.
Let’s look at the bullish perspective for Tezos and the bearish scenario for Monero in the short-term. Both currencies are showing reasonably clear signs of a bounce and a reversal, respectively.
Is Tezos bottom in?
XTZ is currently trading at $2.14 after defending what seems to be a long-term trendline touched several times in the past on September 22, March, and even in October 2019.
XTZ/USD daily chart
Additionally, the Parabolic Stop and Reverse Points (SAR) turned bullish, which further confirms the theory that the direction of the downtrend is changing.
XTZ Volume
Furthermore, although the trading volume has been declining since the beginning of September, Tezos has seen a significant spike in volume over the past three days after successfully defending the long-term trendline support.
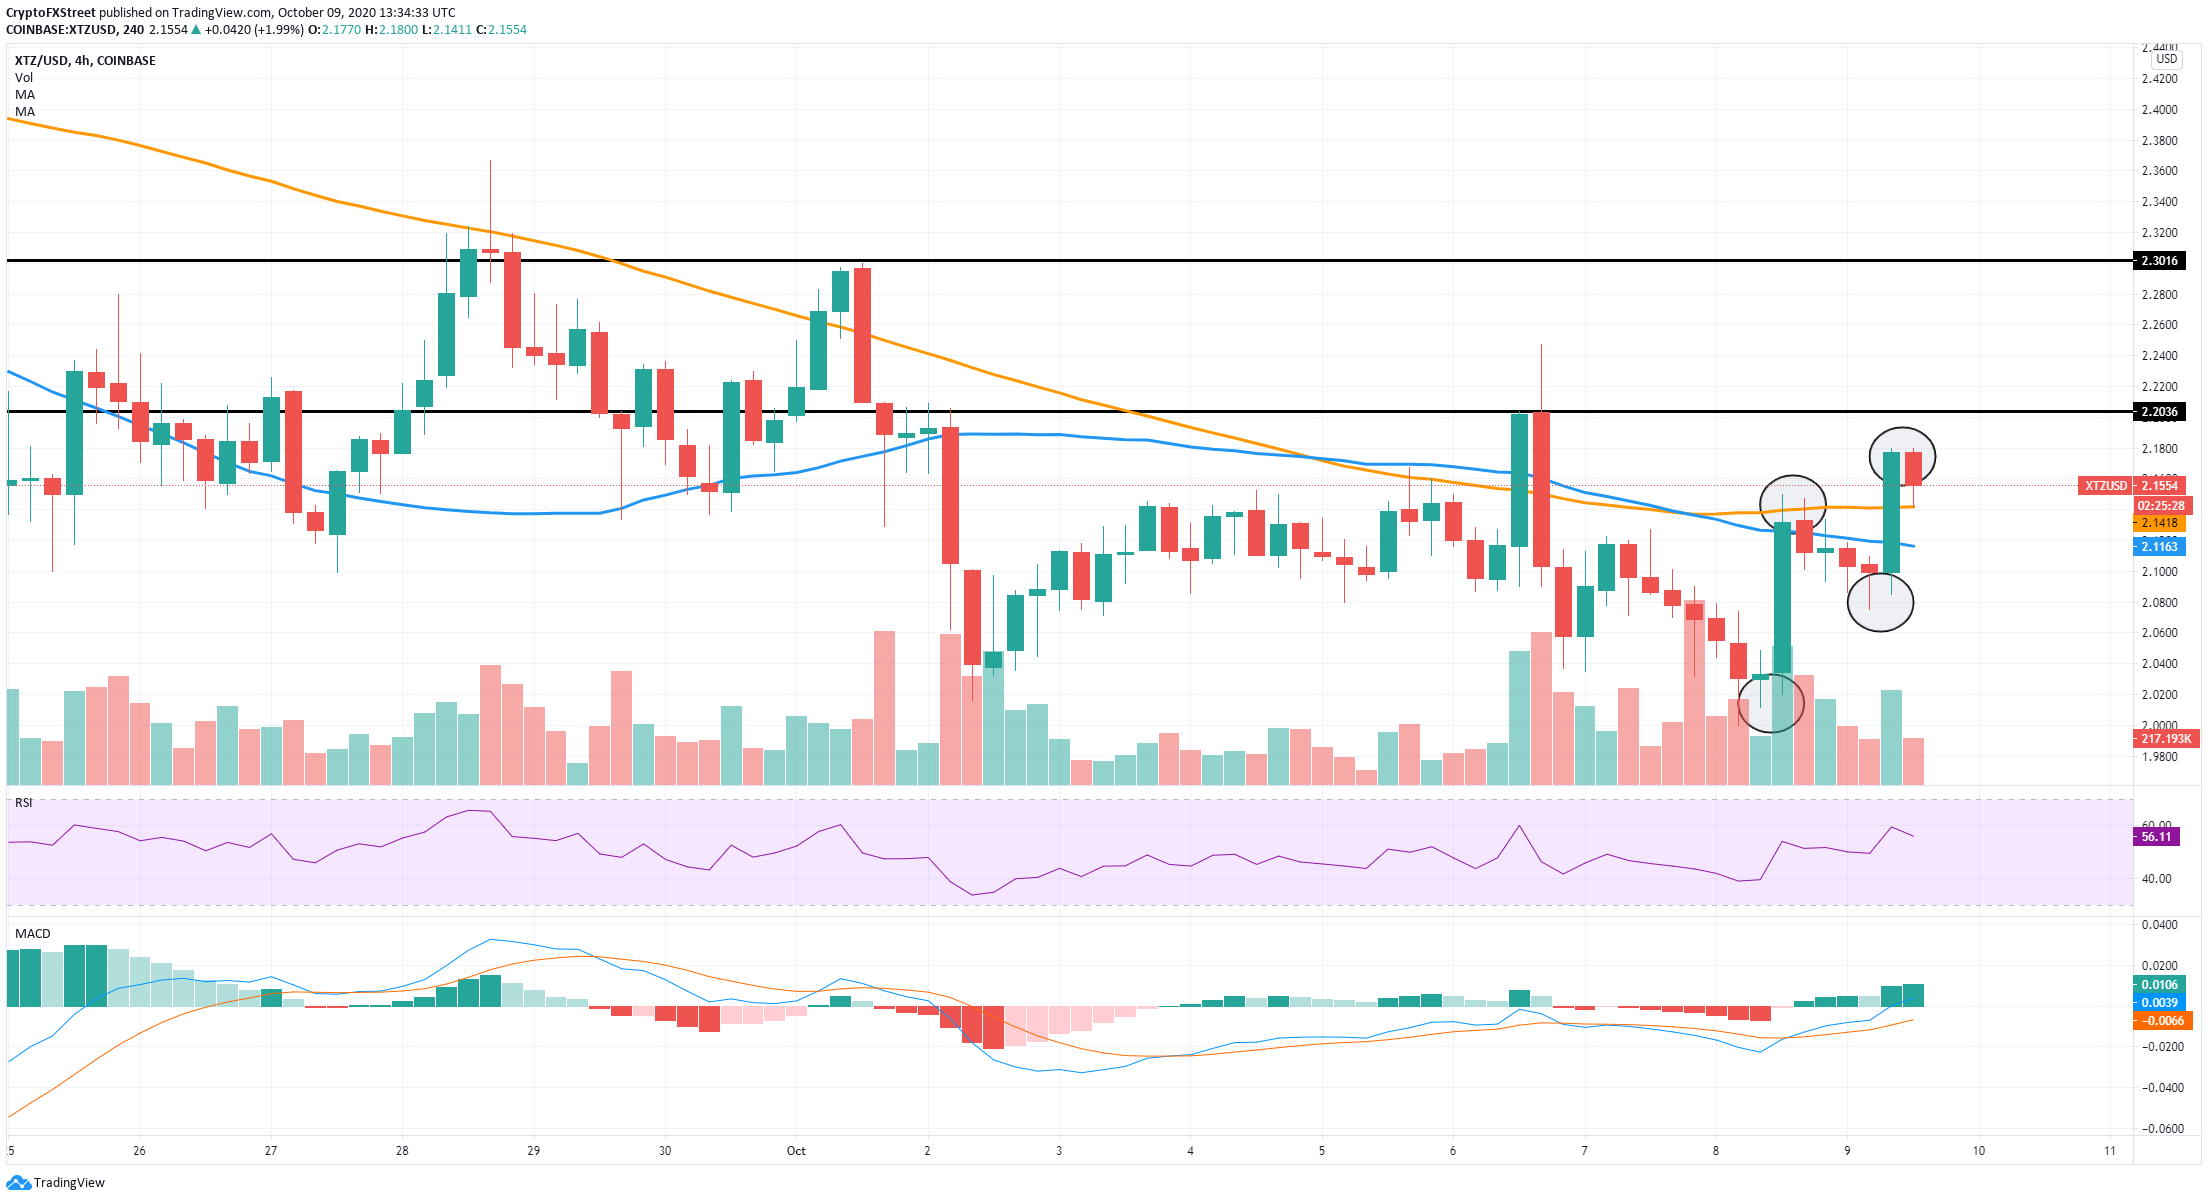
XTZ/USD 4-hour chart
On the 4-hour chart, bulls show a lot of strength after the MACD crossed bullishly and the price climbed above the 50-SMA and the 100-SMA, turning both into support levels. In the short-term, there are several key resistance levels located at $2.2 and $2.3
It’s also worth noting that XTZ established a higher low at $2.07 compared to the previous at $2, and a high at $2.15, followed by a higher high at $2.18, confirming a 4-hour uptrend.
The daily chart shows a possible target price of $2.6 where the 50-SMA is located; however, bulls could eye up even $2.87, the 100-SMA.
Several indicators are showing Monero potentially looking at a reversal
XMR is trading at $112, hinting at a potential reversal period after just establishing a new 2020-high at $114.
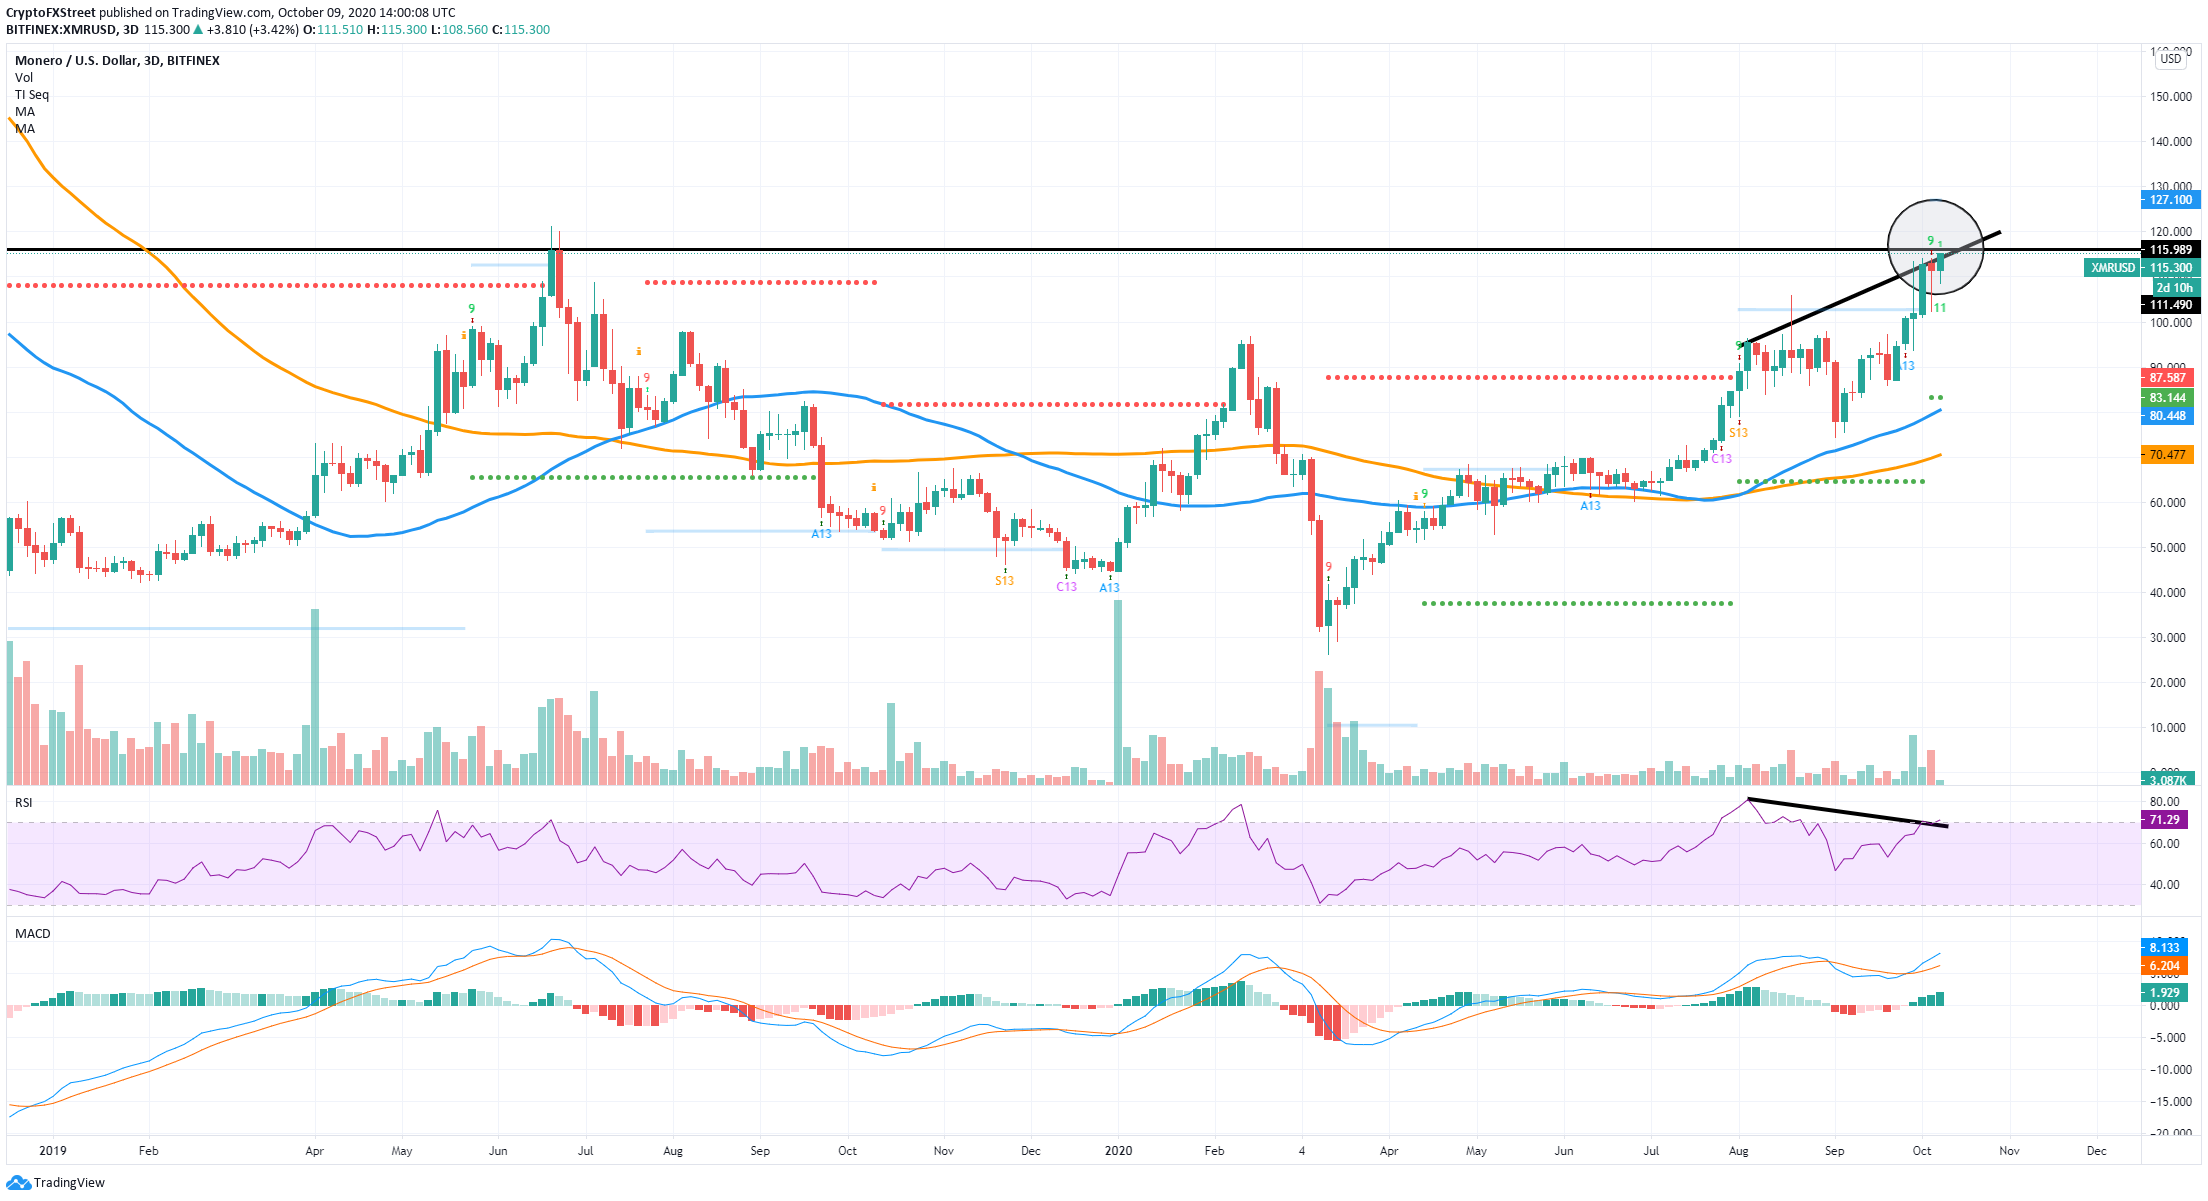
XMR/USD 3-day chart
On the 3-day chart, the TD Sequential indicator presented a sell signal on October 6 and seemed to be topping out at $116, a resistance level established in June 2019. Additionally, the RSI and the price formed a notable bearish divergence.
The price has formed higher highs, but the RSI established lower highs, which creates a bearish divergence and indicates the trend is weakening.
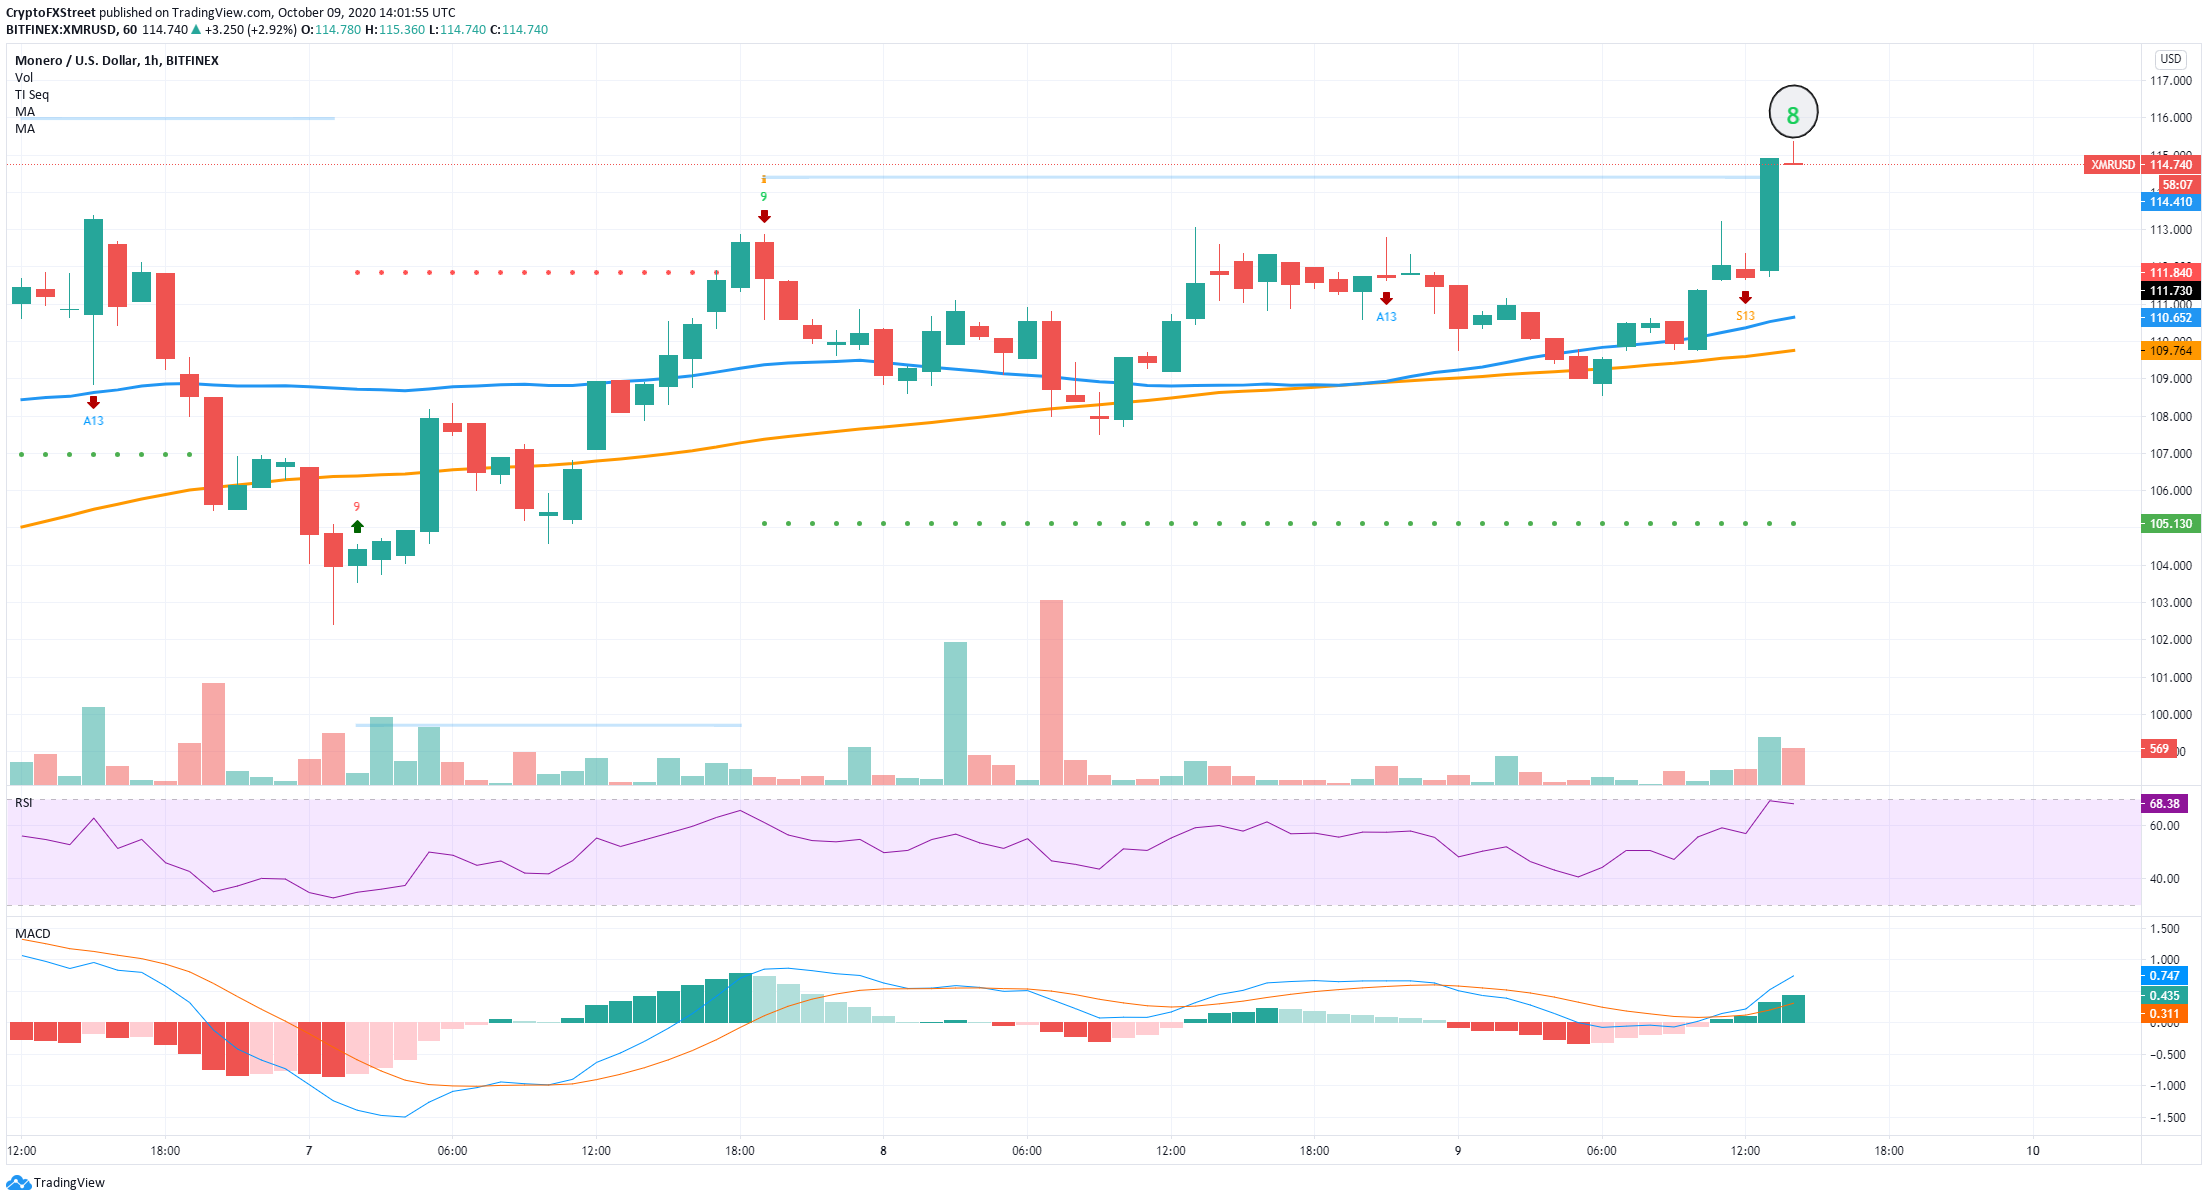
XMR/USD 1-hour chart
On the 1-hour chart, the TD sequential indicator has presented a green ‘8’ signal, which usually precedes a sell signal. Validation of the 3-day sell signal and the hourly signal has the potential to drop XMR down to $96, an older resistance level on the 3-day chart.
A longer-term target price would be $80, where the 50-SMA is set on the 3-day chart, and $70, the 100-SMA.

 [15.27.56, 09 Oct, 2020]-637378494733701036.png)


