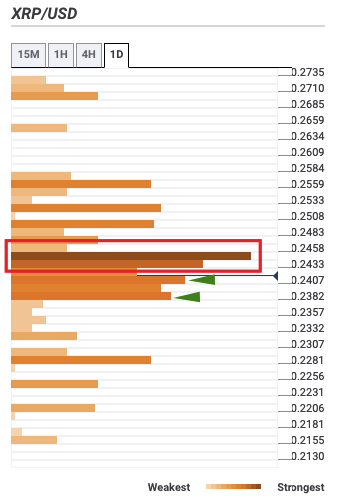
- Daily confluence detector shows that price is stifled under strong resistance stack.
- XRP is currently consolidating itself and prepping for a breakout.
XRP bounced up from the $0.222 support line and managed to jump above the downward trending line. Following that, as you can see, the price has been trending horizontally around the $0.242-mark, below the SMA 20 curve.
XRP/USD daily chart
A horizontal price movement shows us that the forces of supply and demand are nearly equal. This usually happens when an asset goes through a period of consolidation before breaking out into a previous trend or reversing it into a new direction. Also, note how the RSI indicator is trending around the neutral zone, showing that the buyers and sellers are canceling each other out.
XRP/USD 4-hour chart
The sellers have taken the price down from $0.246 to $0.24 over two sessions, breaking below the upward trending line, in the process. As of now, the price has bounced up from the $0.24 support level and is consolidating below the SMA 20 curve.
So, can we expect any price movement at all? Or is XRP going to keep moving along sluggishly in the near future? For that, let’s check the daily confluence detector.
XRP daily confluence detector
XRP is presently stifled below a heavy stack of resistance between $0.243-$0.245. If the bulls somehow gain enough momentum to break above this robust stack, the price has space to grow till $0.2735. On the downside, there are two moderate-to-strong support levels at $0.2415 and $0.24. If the price breaks below these levels, it will be pretty catastrophic for the bulls since the price may plummet to $0.21.
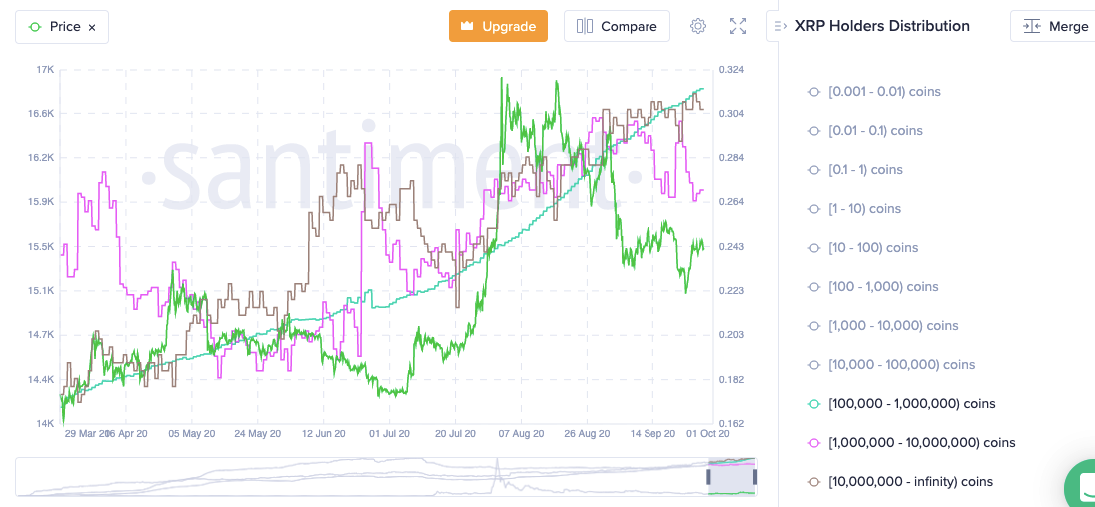
XRP holders chart
Santiment’s holder distribution chart helps check how much of the XRP tokens are held by holders in different token brackets. On September 23, the number of holders with >10 million XRP dipped from 310 to 307, which caused a slight correction in price. Following that, there was another slight dip (313 to 311) in this token bracket over the last two days, while the number of holders in the 1M to 10M and 100,000 to 1M brackets have gone up. As such, the price has managed to move horizontally, instead of facing a massive bearish or bullish breakout.

-637369538229286189.png)

