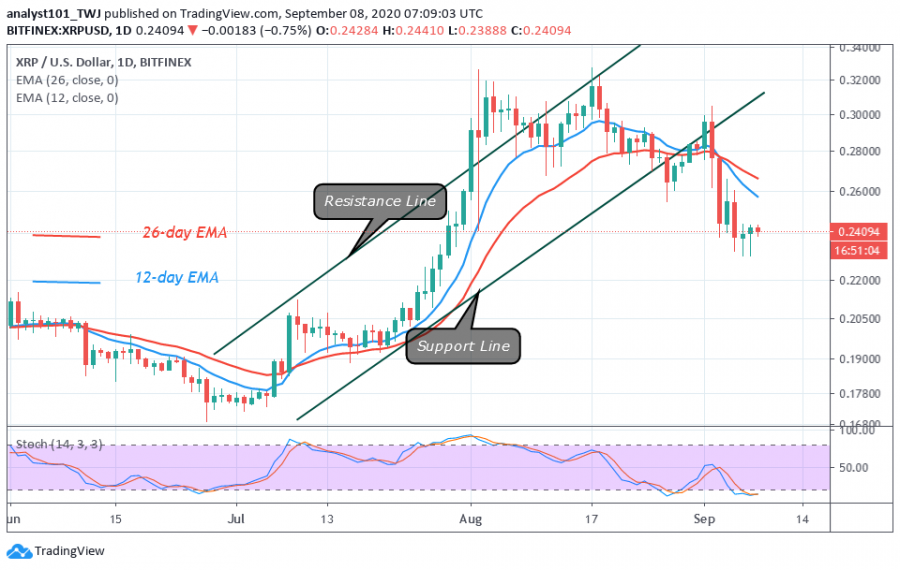
In the last bearish impulse, on September 5, Ripple dropped to $0.23 support and resumed consolidation above it. For the past three days, the price has been fluctuating above the $0.23 support.
Buyers will have an uphill task if they have to push the coin above the $0.28 high. This is a view of strong rejection at the previous highs.
On September 4, buyers pushed the coin to the previous highs but faced rejection at the $0.26 high. The upside momentum would have resumed if buyers were successful above $0.26 high. Today, price is fluctuating above $0.23 support after it was repelled. On the downside, if sellers break the current support the market will fall to $0. 21 low. The selling pressure will extend to $0.195 low if the bearish momentum persists.
Ripple indicator analysis
Ripple has fallen below the 20% range of the daily stochastic. This suggests that XRP is in the oversold region of the market. It implies that buyers may take control of the price. However, in a trending market, an oversold condition may not hold. XRP is in the bearish trend zone as the price is below the EMAs.

Key Resistance Zones: $0.35, $0.40, $0.45
Key Support Zones: $0.25, $0.20, $0.15
What is the next move for Ripple?
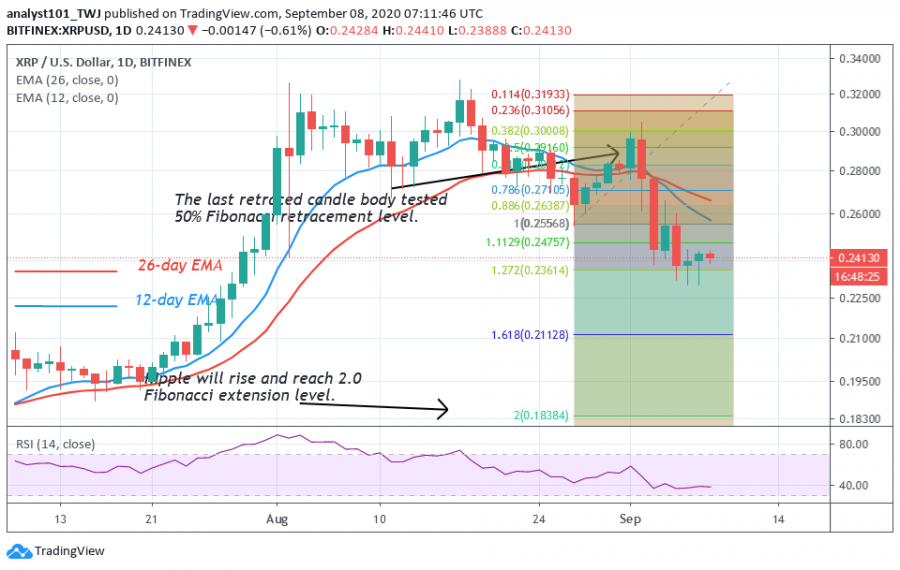
A downward movement of the coin is expected if the price breaks the $0.23 support. On September 1, the price corrected upward, the retraced candle body tested the 50% Fibonacci retracement level. The implication is that once the current support is broken, Ripple will fall and reach the 2.0 Fibonacci extension level or $0.183 low.

Disclaimer. This analysis and forecast are the personal opinions of the author that are not a recommendation to buy or sell cryptocurrency and should not be viewed as an endorsement by CoinIdol. Readers should do their own research before investing funds.
