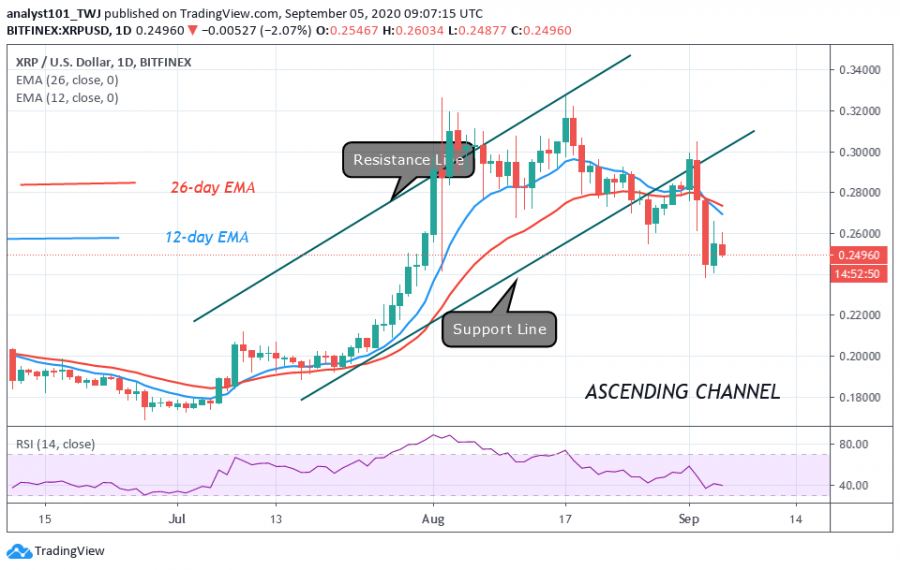
Yesterday, buyers could not hold the $0.26 support as bears broke the support level. The implication is that further downward move is likely.
Initially, the coin dropped to $0.23 low but it is now trading at $0.25 at the time of writing. Buyers have an uphill task to push the coin to the previous highs. However, a strong bounce above $0.23 support will propel price above the EMAs.
This will enable buyers to resume upside momentum. The bullish scenario will be invalidated if buyers failed to act. This will allow sellers to further push prices down. Nevertheless, Ripple will fall to $0.19 support, if price breaks the $0.23 support. In the meantime, Ripple is fluctuating between $0.23 and $0.26. Ripple may fall as price is in the bearish trend zone.
Ripple indicator analysis
The price has broken below the EMAs as the downward move resumes. Buyers were attempting to push XRP above $0.26 high but were repelled. The crypto is facing rejection as a downward move may follow. The coin is at level $41 of the Relative Strength Index period 14. It is below the centerline 50 which makes it vulnerable to fall.

Key Resistance Zones: $0.35, $0.40, $0.45
Key Support Zones: $0.25, $0.20, $0.15
What is the next move for Ripple?
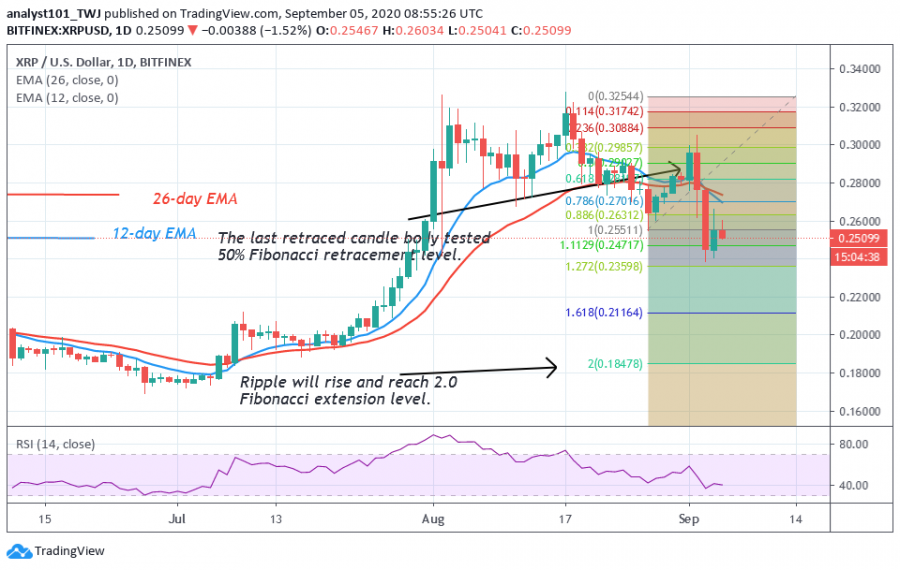
As price breaks the $0.26 support, sellers now have control of price. On the August 27 downtrend, the coin reached the low of $0.26 but the retraced candle body tested the 50 % Fibonacci retracement level. This indicates that the market will fall to a low of 2.0 Fibonacci extensions Level or $0.185 low.

Disclaimer. This analysis and forecast are the personal opinions of the author that are not a recommendation to buy or sell cryptocurrency and should not be viewed as an endorsement by CoinIdol. Readers should do their own research before investing funds.
