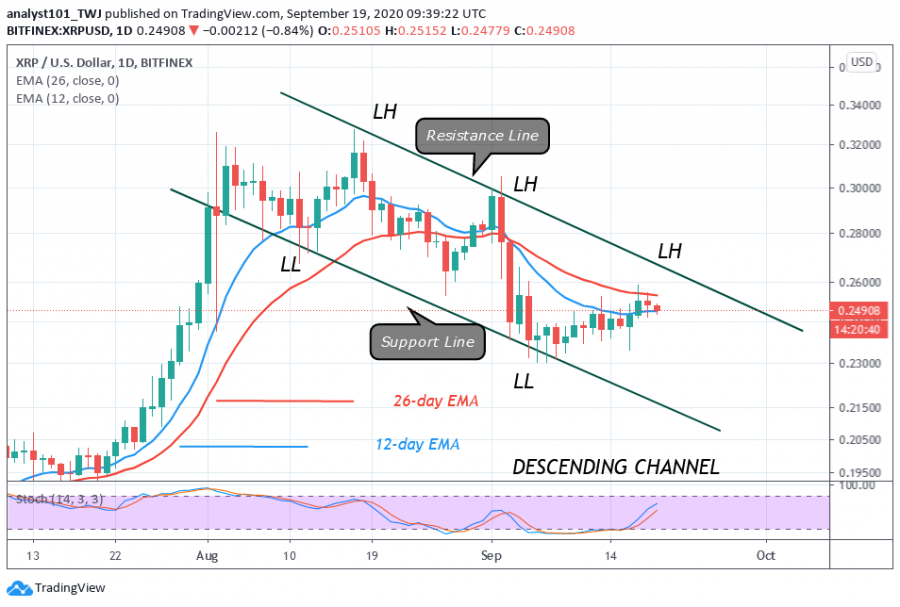
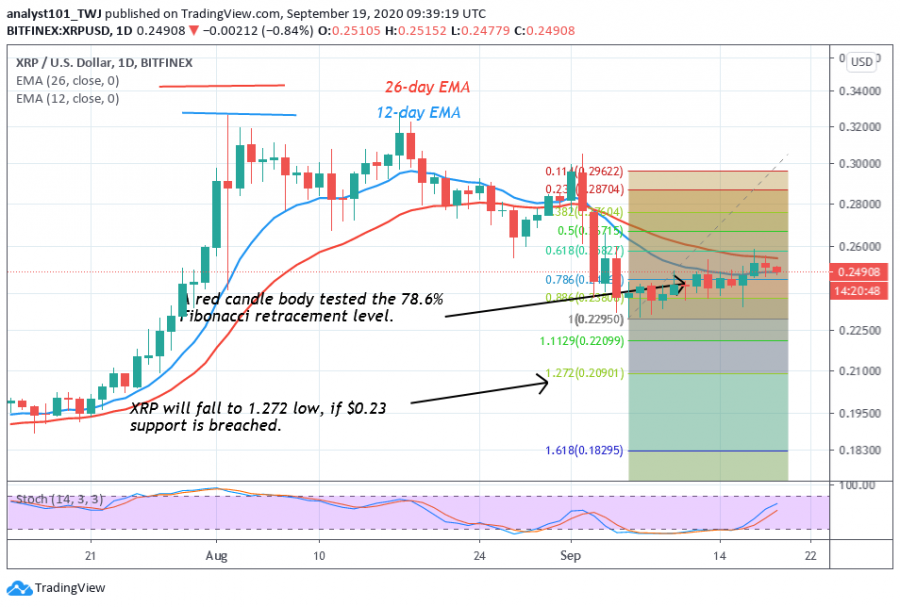
Ripple continues to fluctuate above $0.24 support for the past three days despite buyers’ failure to push the price above the $0.26 resistance.
Ripple has been making a series of lower highs (LH) and lower lows (LL) price patterns. The market has reached the lower highs region and the coin is facing resistance.
The bearish pattern will resume if the coin faces rejection at the recent high. In other words, XRP will further decline to $0.23 and later to $0.21. For example, if this lower high is broken, the bearish pattern will be invalidated. That is the price momentum will be strong enough to break the EMAs and the $0.26 resistance. This will guarantee the resumption of the upside momentum. In the interim, ETH is trading above the $0.24 but the price action is showing bearish signals.
Ripple indicator analysis
A bearish candlestick is breaking below the EMAs. A break below the EMAs suggests a further downward movement of the coin. The daily stochastic is showing a bullish momentum above the 60% range. This is contrary to the price action which indicates a bearish signal.

Key Resistance Zones: $0.35, $0.40, $0.45
Key Support Zones: $0.25, $0.20, $0.15
What is the next move for Ripple ?
The bearish pattern has not been broken, nor has it resumed. The price is still fluctuating above $0.24 support. It is not certain which direction XRP will trend. The advantage is on the sellers as the price is in the bearish trend zone. A break below $0.23 support will confirm whether the downtrend will resume.

Disclaimer. This analysis and forecast are the personal opinions of the author and not a recommendation to buy or sell cryptocurrency and should not be viewed as an endorsement by CoinIdol. Readers should do their own research before investing funds.
