Outlook for LTC-USD: September 19, 2020
Litecoin (LTC-USD) continues to bear its close correlation with Bitcoin (BTC-USD). The drop in BTC-USD from 12,000 to just above the 10,000 level was followed by a similar move in LTC-USD from $63 to below $48 in August/early September 2020. What is the price outlook for LTC-USD heading into the 4th quarter of 2020?
Fundamental Analysis
Litecoin is starting to lend its blockchain towards game development. Cipsoft, a German company, has announced plans to launch the first role-playing game on the Litecoin blockchain. LiteBringer, Cipsoft’s game on the Litecoin blockchain, would enable the earning of rewards for performing quests using fantasy characters. LTC miners would process transactions and develop the reward structure. This venture could open up the Litecoin blockchain for further adoption, creating a new channel for blockchain-based gaming. EOS and TRON have been the two popular blockchain networks for online gaming.
This development follows the addition of Litecoin support to Revolut in the US, as it launches its new crypto exchange service for US customers. This raises to four, the number of cryptocurrencies that can be bought, sold or stored on the Revolut platform in the US.
These events are expected to drive the adoption of Bitcoin in the long term and may not have an immediate impact on price action on the LTC-USD pair.
Technical Analysis
The technical analysis for LTC-USD starts from the weekly chart where we can see that price is basically forming lower highs and has at least one lower low. So, the price is basically in a downtrend. The key question here is whether the price activity has enough bearish momentum to push below the 48.36 support. If price breaks below this level and drops all the way below 22.81, this forms a new low to extend the downtrend.
LTC-USD Weekly Chart: September 19, 2020
If price breaks below 48.36 but fails to establish a new low by breaking down 22.81, then we could be in for some consolidation in the medium term. The price picture (descending highs against horizontal lows) would form a descending triangle in that scenario.
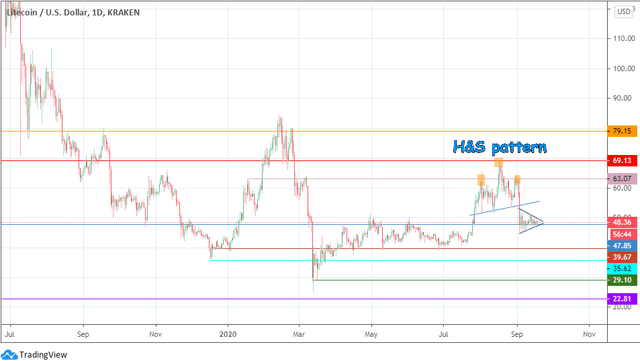
In order to get a better view of price action in the short term, the daily chart is pulled up. This chart shows that price formed a head and shoulders pattern, with a breakdown of the neckline to complete that pattern. The breakdown move quickly went into a consolidation triangle. Collectively, the breakdown and accompanying consolidation form a bearish pennant. This pattern currently rests on the 48.36 support.
LTC-USD Daily Chart: September 19, 2020
The technical expectation for the price to continue the decline by breaking below the pennant. This move would break down the 48.36 support line, bringing 39.67 into the picture as the next support level. We can see that this support is formed by several price troughs between April and August 2020. The decline to this support would potentially complete the measured move from the head and shoulders pattern. Further weakness takes LTC-USD towards 35.62, with 22.81 lining up as potential support which would only come into the picture if 35.62 gives way. An extended decline below 22.81 is required to reinstate the medium-term downtrend, as seen on the weekly chart.
On the flip side, a bounce from the present support may invigorate the bulls and bring them into the market. This bounce would present the LTC-USD pair with the opportunity to retest the neckline of the head and shoulders pattern. If this price move breaks above the neckline, the decline and the pennant would be invalidated. Price would then have the chance to aim for 63.07, which is the site of price tops of January and March 2020, as well as the two shoulder tops. Above this level, 69.13 becomes the new upside target. However, only a break above 79.15 confirms a change in the trend in the medium term.
Market Sentiment
The market sentiment for LTC-USD is as follows:
- Long term: bearish
- Medium term: bearish
- Short term: neutral to bearish
Long term and medium term, the outlook for LTC-USD remains bearish, as the price continues to form lower highs and lower lows. This outlook is a bit weak in the medium term, as the price would need to establish a new low below 22.81 to maintain the downtrend.
In the short term, the price outlook remains neutral. However, the pattern gives a bearish bias to the short-term setup, which could change the outlook here from neutral to bearish if price breaks below the consolidation area.
Did you know that Bitcoin is up +$3,000 since 1/1/20? As world markets plummet due to COVID, investors are turning to crypto now more than ever.
We provide news, research, technical analysis and more at the Coin Agora on all things crypto!
Sign up now and get instant access to our Pick Portfolio – where three of our picks are up more than 180% in the last 12 months.
Disclosure: I/we have no positions in any stocks mentioned, and no plans to initiate any positions within the next 72 hours. I wrote this article myself, and it expresses my own opinions. I am not receiving compensation for it (other than from Seeking Alpha). I have no business relationship with any company whose stock is mentioned in this article.

