- Ethereum is currently trading at $337 after plummeting from a high of $376.
- ETH could be aiming to re-test the critical $300 support level.
Ethereum lost more than 10% of its value within the last 12 hours dropping from a $42 billion market capitalization to a current low of $38 billion.
ETH/USD 4-hour chart
Ethereum formed a bear flag on the 4-hour chart which started its flag pole On September 1. The upwards consolidation period started on September 6 and the pattern has now clearly broken bearish now but has not yet slipped below the low of the pole at $310.
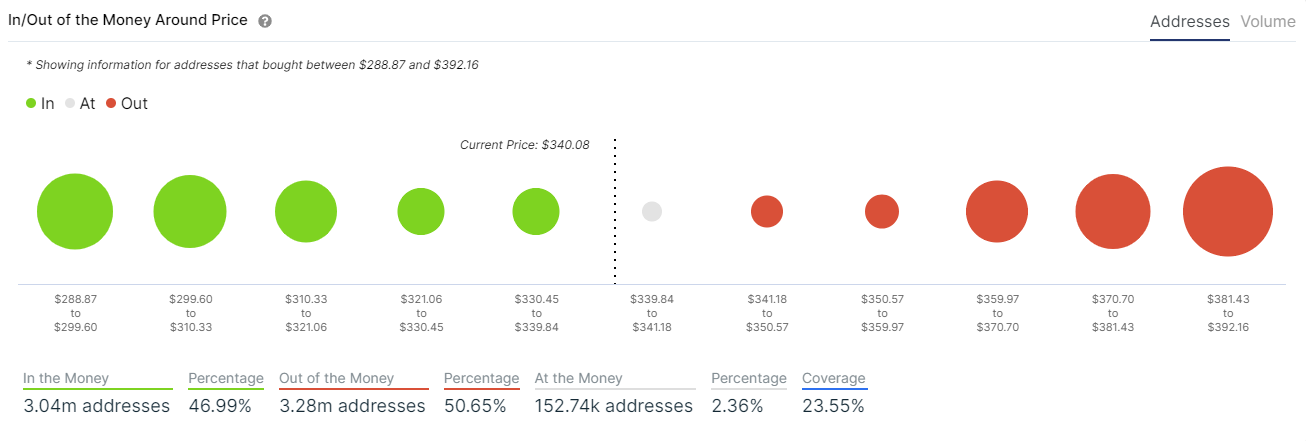
ETH IOMAP Chart
The IntoTheBlock’s In/Out of the Money Around Price model (IOMAP) shows the next support level to be at $337 followed by $326. However, the biggest support levels are found at $304 and $294 where 861,000 addresses and 927,800 respectively bought ETH. A maximum possible target for the bearish outlook would be close to $200 as that’s the length of the flag pole. The IOMAP seems to indicate that Ethereum is poised to re-test at least the $304 level.
On the other hand, the smart-contracts pioneer is not facing a lot of resistance well until $365 but there doesn’t seem to be a lot of bullish momentum to push it to that level. If bulls can recover, ETH price will be looking to reach $365 where the next most important resistance cluster is located at.

