Cardano has been dropping quickly in value and currently stands at $0.0880 with a market cap of $2.7 billion, which has also seen a drop from $3.16 billion in the last 24 hours. No longer in the top-10 ranks, ADA’s journey south does not seems to be over yet.
Cardano 1-day chart
ADAUSD TradingView
The one-day chart for Cardano showed that the price had breached 0.5 Fibonacci level at $0.09449. The subsequent drop to 0.618 Fibonacci level at $0.07622 seems likely, however, a further drop can be possible considering bitcoin’s trading at the $10,000 level. Although a drop to 0.786 Fibonacci level is possible, there are supports between 0.618 and 0.786.
The zone between 0.618 and 0.65 Fibonacci is known as the golden pocket and we might see ADA go sideways in this zone [$0.076 to $0.0712].
Although indicators for Cardano are indicating a bounce from here, they have to be neglected for the time being as bitcoin’s drop will push altcoins to follow it.
Hence, the initial targets for ADA include $0.07622 at a 13% drop from the current price. This will be followed by $0.0712, which is an 18% drop and finally a 42% drop to $0.05000, which will be the bottom for Cardano.
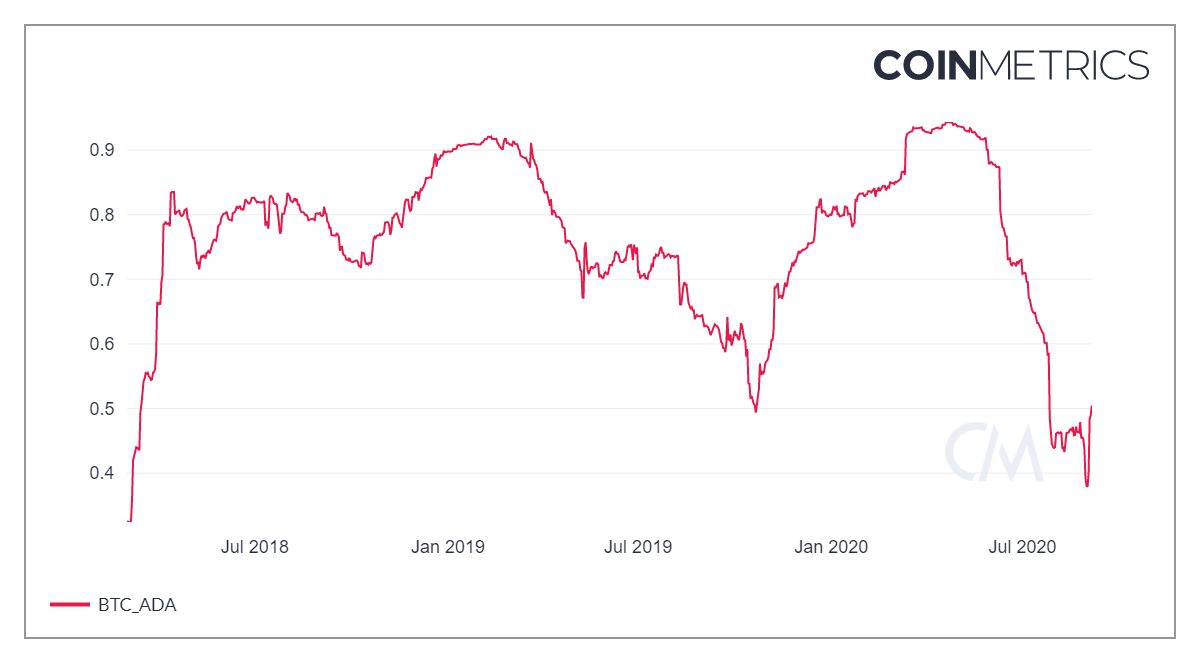
Cardano and Bitcoin correlation

Source: Coinmetrics
Altcoins have seen a great ride up in the last few months and ADA might have started the rally before most altcoins. Cardano pumped from $0.017 to $0.1719, a whopping 900% increase in less than 5 months.
However, the surge in bitcoin’s price to $12,000 was accompanied by the increase in the dominance of bitcoin. Hence, the correlation of alts with bitcoin has also increased.
As seen above, Cardano’s 90-day Pearson correlation has increased from 0.378 to 0.50 since 1 September. This increase is largely due to bitcoin’s crash. Hence, a further drop in Cardano’s price can be an expected result if bitcoin drops as well.
The bottom for bitcoin’s crash could be the CME gap at $9,645 or it could dip a little lower and head to $9,100 too. The same goes for Cardano’s price, hence, the likely bottom for ADA is $0.0500.
