- Both BTC and XRP have charted the bearish cross pattern with the SMA 50 crossing over the SMA 20.
- Ethereum has faced a lot of criticism recently for its increasing gas fees.
Bitcoin
BTC/USD bears regained control of the market after two bullish days as the price fell from $10,377 to $10,020. The price ventured below $10,000 for a bit before immediately recovering. However, the daily chart has two indicators that show us that a break below $10,000 will soon be inevitable.
- Firstly, the SMA 50 has crossed over the SMA 20 to chart a bearish cross pattern.
- Secondly, the relative strength index (RSI) is still trending next to the underbought zone. This shows that the asset isn’t completely undervalued yet.
When BTC/USD breaks below $10,000, the price can drop further until it encounters healthy support at $9,634.
BTC/USD daily chart
Ethereum
The price of Ethereum has been free-falling significantly in recent times. The second-largest digital asset (by market cap) recorded a two-year high of about $490 a few days back. While a few experts predicted the coin to exceed $500, the coin moved drastically in the other direction. After losing value rapidly, ETH first broke below $400 and fell further to nearly $310, losing about 35% in the process. Currently, its priced at $336.42.
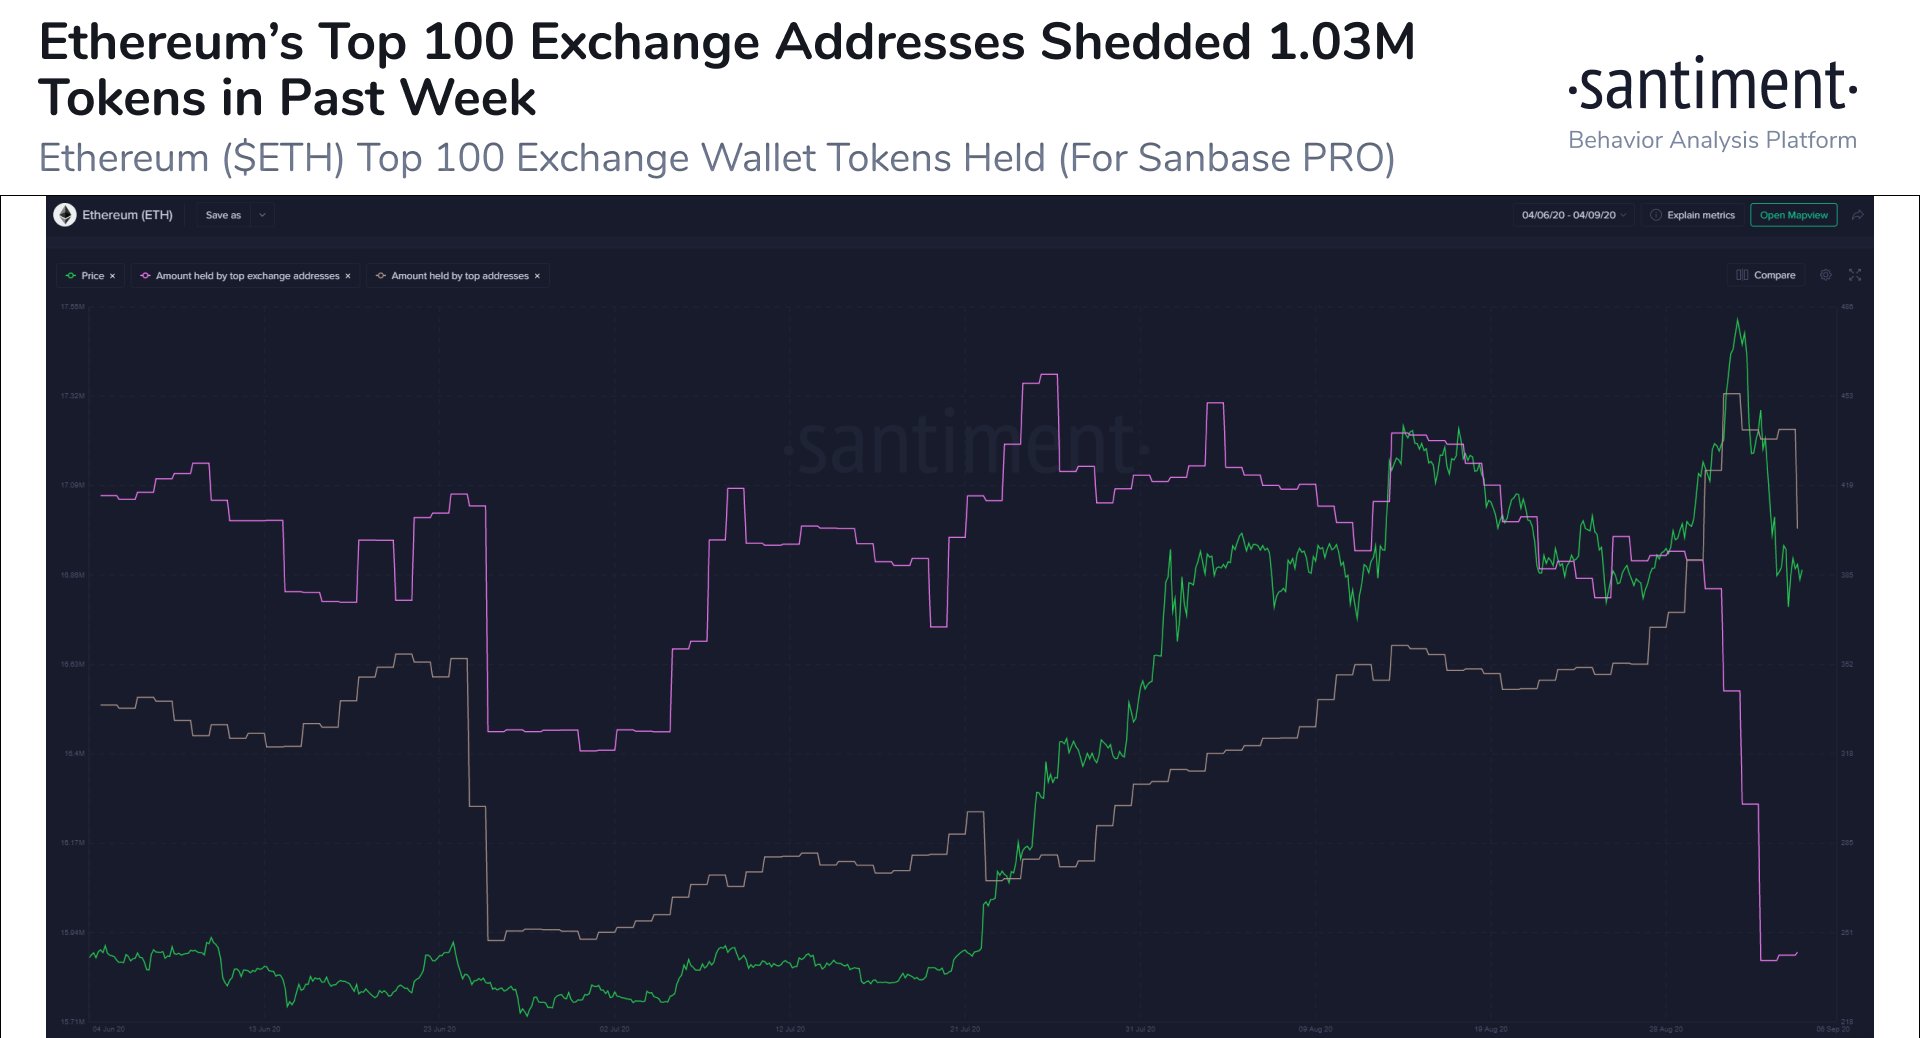
Data taken from Santiment shows that Ethereum whales may have been ahead of the curve. As the coin’s price was headed to its recent high, the top 100 exchange addresses started disposing of their tokens. The firm noted that these addresses “decreased their tokens held from 16.92 million to 15.89 million over the past week.” According to Santiment, this was “certainly” a spark plug to the massive price dump.
An earlier CryptoPotato report noted that the number of devs utilizing the Ethereum network has been spiking since 2018. The Ethereum-specific code packages downloaded in 2020 have exceeded the downloads from 2018 and 2019 consolidated. Furthermore, the Medalla testnet has drawn over 1.1 million test Ethers, a significant increase from the numbers a week earlier.
These developments have had a noticeable impact on Ethereum. While the increased usage indicates that more users are utilizing the Ethereum blockchain, it also brings out notable issues. For instance, the network has become almost constantly clogged. The Ethereum mempool displays a large number of pending transactions, which skyrockets the fees on the network.
Surging fees on Ethereum
Amid the ongoing boom in the decentralized finance (DeFi) sector, gas fees for Ethereum transactions have been surging. According to a Cointelegraph report, three renowned computer scientists involved in the DeFi space shared their views on solutions about the high gas fees on Ethereum. The three scientists include Sergej Kunz, CEO of decentralized exchange 1inch, Mounir Benchemled, the founder and CEO of ParaSwap and Alex Kumanovic, co-founder at bloXroute Labs, a blockchain distribution network (BDN).
Although the three of them have various opinions and approaches to the solutions, all agree that Ethereum 2.0 is not the answer to high transaction costs. The scientists noted that while ETH 2.0 has its trade-offs, it will not be scalable and secure enough to facilitate the users’ transactions.
Kunz said that ETH 2.0 is designed to accelerate Ethereum’s usage and adoption. However, he said that it would scare many new users into the DeFi space because of the current gas price. He added that the infrastructure needs to be rethought all over again.
You have to rethink everything. You can migrate smart contracts to the code, but it’s not scalable. To be able to scale, you have to create standards and bring new protocols based on the new sharded architecture, such as NEAR, which is similar to Ethereum 2.0.
While Mounir conceded that ETH 2.0 could be scalable, he also noted that its launch had continuously been delayed because of the massive security requirements. Given its critical nature, the core team must ensure the protocol is entirely secure before launching it.
Solutions such as layer 2 are being introduced to solve the problem of high costs. The general idea of layer 2 is to move the transactional load, or at least a portion of it, off the blockchain network. While it can be pretty useful, the process of explaining all the complexities to the end-user can be counterproductive.
Kumanovic concluded that before Ethereum 2.0 exists, the developers will have to work with everyone involved: community, transaction generators, miners and build applications and bring users on board.
Block.One CEO criticizes Ethereum for slow transactions
Brendan Blumer, CEO of Block.One – the company behind EOS – has criticized Ethereum for creating a “slow, costly, high inflation” blockchain that is widely under the control of the three largest mining pools. To continue generating high mining fees, Blumer said that Ethereum’s mining “cartel” refuses to upgrade the network’s scalability.
Blumer called EOS an “indisputable upgrade” to Ethererum that has continued to “deliver technological innovation monthly.” The CEO said that the Ethereum community attacks EOS regarding centralization to cover up for their shortcomings.
#Ethereum has resulted in slow, costly, high inflation chain, controlled by a 3 pool cartel that refuses to upgrade the scalability of the protocol, while taking billions per year in mining fees as well as $90 per transaction, and selectively reversing transactions (DAO vs DOT)
— Brendan Blumer (@BrendanBlumer) September 5, 2020
Blumer had previously praised EOS for having the “performance, liquidity and developer community” to support DeFi applications that are not possible on other blockchains.
#EOS has the performance, liquidity, and developer community to support #DeFi applications that aren’t possible anywhere else.
— Brendan Blumer (@BrendanBlumer) August 15, 2020
ETH/USD daily chart
ETH/USD bulls lost steam at the $355.22 resistance level. The price has since dropped down to $336.42. The MACD suggests increasing bearish momentum, which means further price drop is expected. The $318 support level needs to hold firm to prevent ETH from dropping below the $300-level.
Ripple
XRP/USD has charted the bearish cross pattern after the SMA 50 has crossed over the SMA 20. This has prompted the sellers to take back control of the market as the price dropped from $0.2424 to $0.2363. Over the last 7 days, XRP/USD has experienced intense selling pressure as the price fell from $0.2954 to $0.2363. However, the William’s %R is already hovering inside the oversold zone, so a drastic price drop isn’t expected.
XRP/USD daily chart
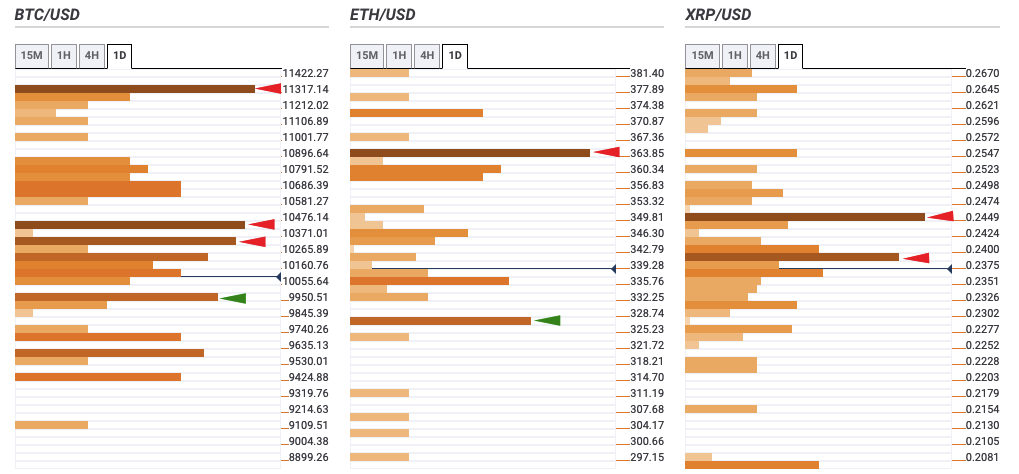
Top 3 coins daily confluence detector
Bitcoin
BTC has three strong resistance levels at $10,300, $10,400 and $11,350.
The $10,300-level has the one-day Fibonacci 23.6% retracement level and one-day SMA 100.
$10,400 has the one-day Previous High and one-week Fibonacci 23.6% retracement level.
Finally, the $11,350 resistance level has the one-month Fibonacci 61.8% retracement level and one-day Bollinger Band middle curve.
On the downside, we have one healthy support level at $9,975, which is highlighted by the Previous Week low.
Ethereum
ETH/USD has one strong resistance level on the upside at $365, which has the Previous Year high and one-day SMA 5.
On the downside, we have one healthy support level at $327, which has the Previous Month low.
Ripple
XRP/USD has two strong resistance levels on the upside at $0.2385 and $0.2460, respectively.
The former has the one-day Fibonacci 38.2% retracement level, while the latter has the monthly Pivot Point one support-one.


-637352055598039245.png)
-637352055991046607.png)
