- Fight for dominance and an overheated Ethereum drive the future.
- Ripple might be a secondary golden player, helping Bitcoin towards new relative highs.
- Market sentiment rebounds and supports change in leadership.
The war for dominance in the crypto market has been going on for weeks, and Bitcoin has been looking for a way to regain market share after several months when Altcoins, and mainly Ethereum, had eaten up a lot of its ground.
The puzzle was how to get King Bitcoin to regain lost ground: a bear market with Bitcoin acting as a safe-haven, or a bull market with Bitcoin leading the way and leaving its competitors behind?
The European morning leaves a few clues in the charts as to where things might be heading. The BTC/USD pair is moving upwards in search of the price congestion resistance level at $11370 before stopping at the psychological level of $11000.
The ETH/USD pair moves lower and seeks support at the $360 price level.
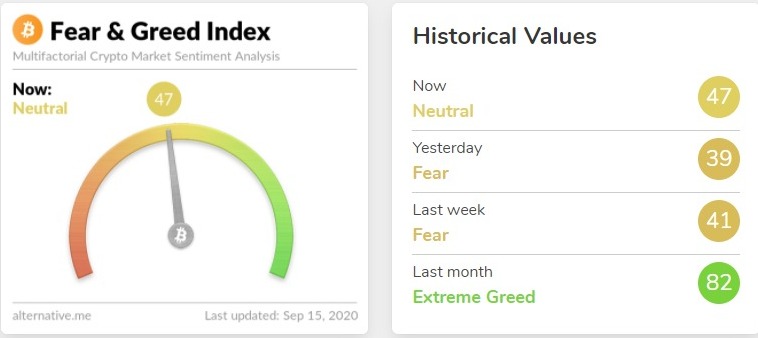
Market expectations seem to be that this will occur, as reflected in a significant rise in market sentiment, which has climbed to 47 (neutral) level after several days indicating that there was a feeling of fear among Crypto market participants.
Source: alternative.me
ETH/BTC Daily Chart
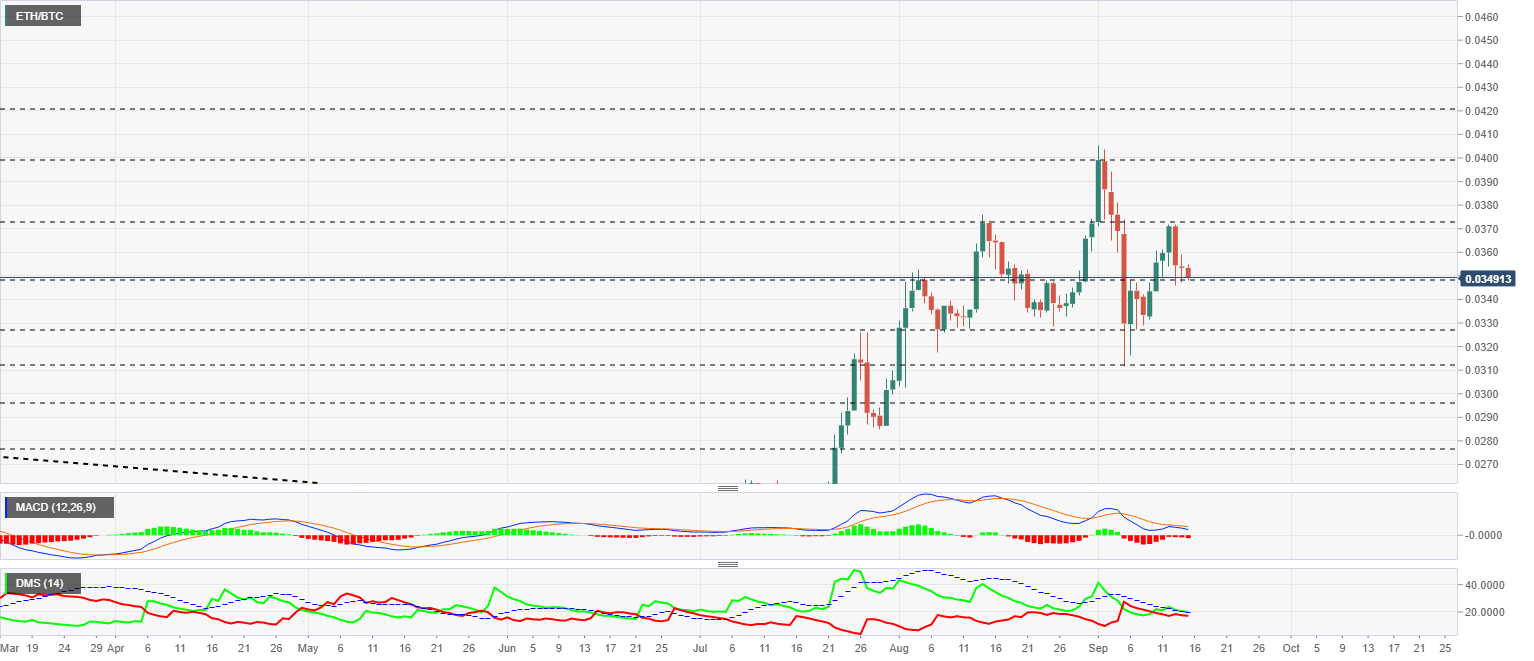
The ETH/BTC pair is currently trading at 0.0349 and falls on the day as Bitcoin’s performance against Ethereum improves. The price congestion support level of 0.0348 appears to have been overcome and points to a move towards lower support levels.
Above the current price, the first resistance level is at 0.0372, then the second at 0.040 and the third one at 0.042.
Below the current price, the first support level is at 0.0348, then the second at 0.0327 and the third one at 0.0313.
The MACD on the daily chart shows an ambiguous structure, with the potential to develop in either direction. The divergence of the MACD indicator from recent highs in the ETH/BTC pair tilts the projection towards the low side of the chart.
The DMI on the daily chart shows both sides of the market-facing each other waiting for the direction the market will eventually take.
BTC/USD Daily Chart
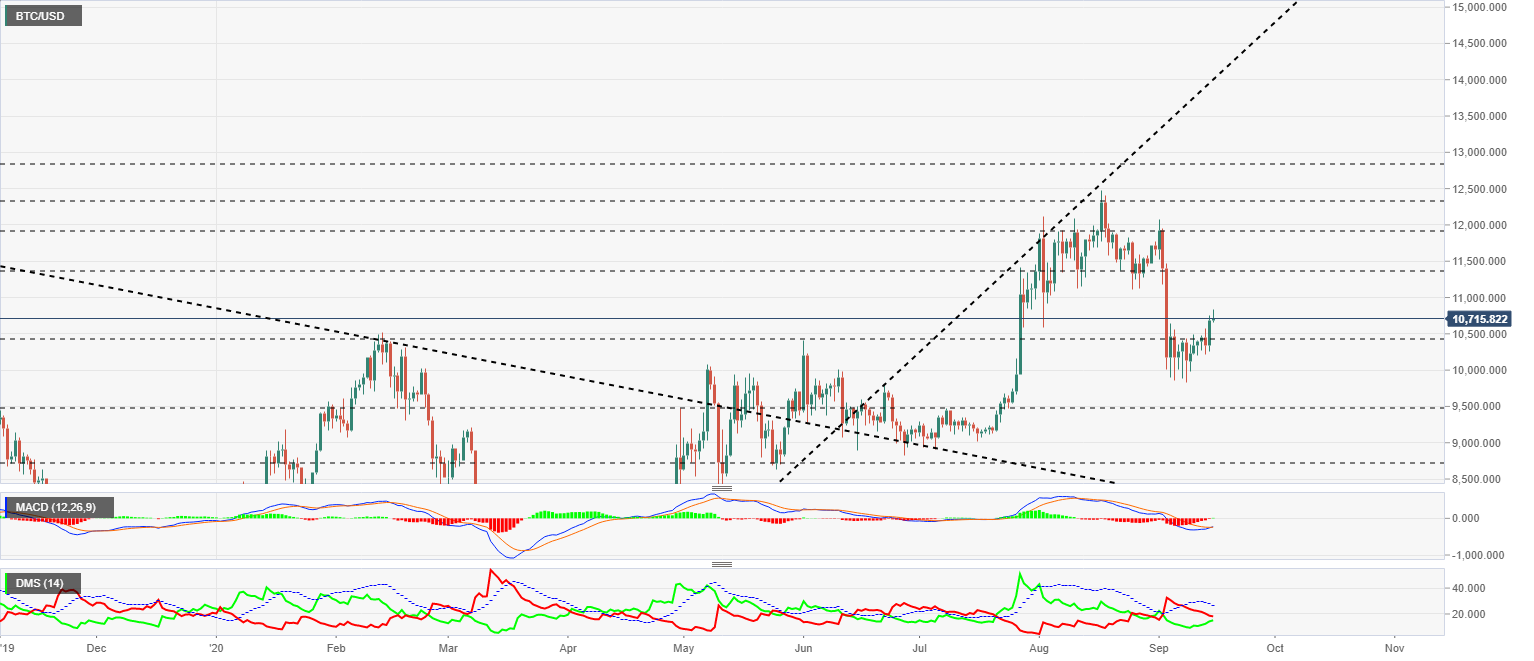
The BTC/USD pair is currently trading at $10717, up from yesterday’s high.
Above the current price, the first resistance level is at $10950, then the second at $11350 and the third one at $11900.
Below the current price, the first support level is at $10450, then the second at $10000 and the third one at $9700.
The MACD on the daily chart shows a bullish cross developing and therefore still to be confirmed. A bearish move in the price would invalidate the movement and could open the door to intense declines in the market.
The DMI on the daily chart shows the bulls in a clear uptrend, reaching the positions on the sell-side already.
ETH/USD Daily Chart
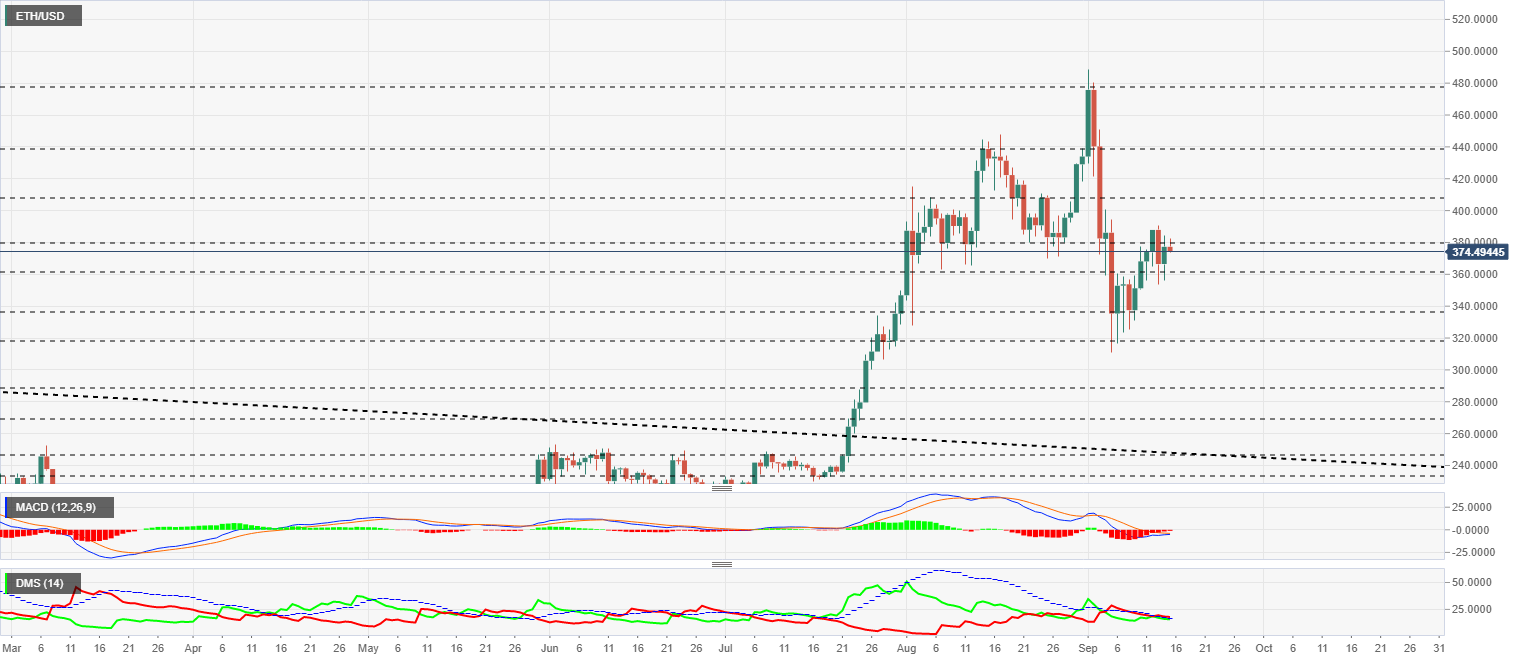
The ETH/USD pair is currently trading at the $374 price level and has failed for the third day in a row to break the price congestion resistance level at $380.
Above the current price, the first resistance level is at $380, then the second at $410 and the third one at $440.
Below the current price, the first support level is at $360, then the second at $336 and the third one at $320.
The MACD on the daily chart shows a flat profile with intentions of completing a bullish cross. The position of the moving averages, below the zero levels of the indicator, along with the flat profile they present, will make it difficult for a bullish signal to succeed.
The DMI on the daily chart shows the two sides of the market-facing each other around the ADX line. Bears have an advantage by positioning and moving above the ADX line.
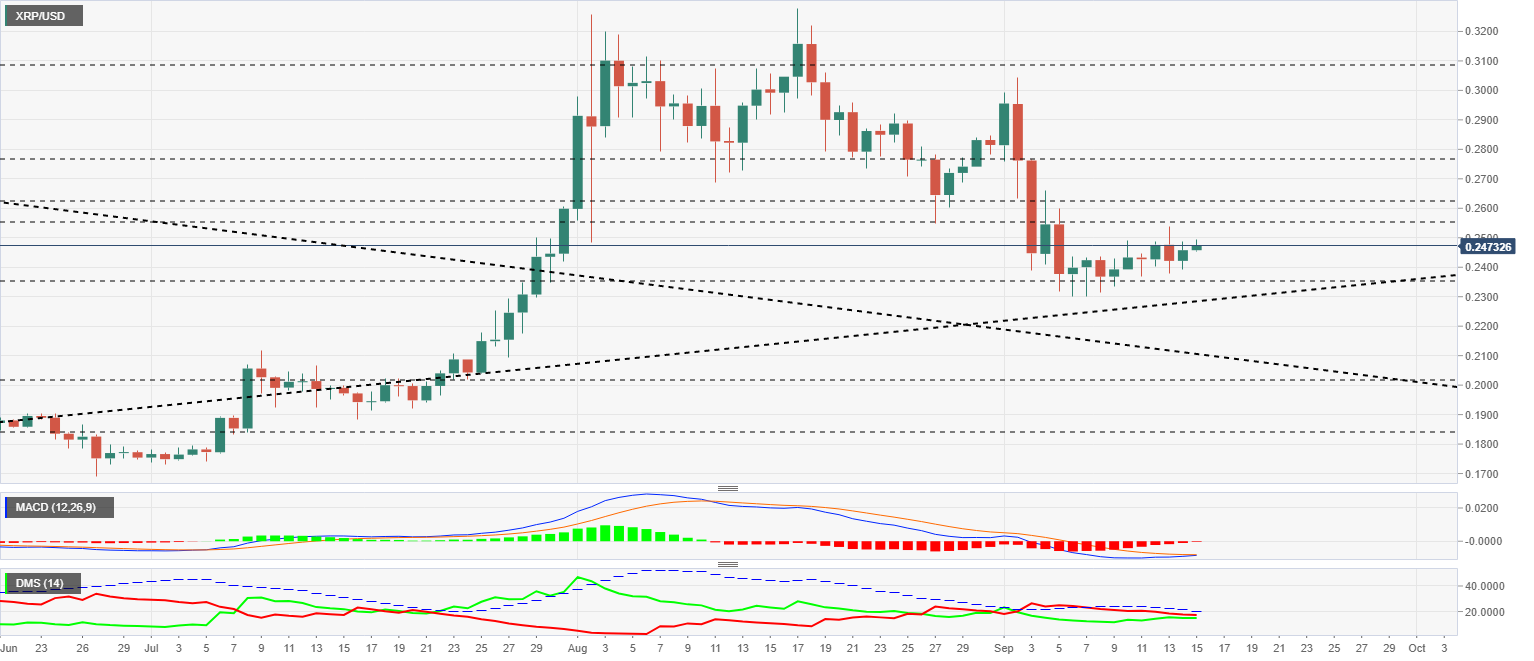
XRP/USD Daily Chart
The XRP/USD pair is currently trading at a price level of $0.2468 and accompanies Bitcoin on the positive side of the market. Ripple may prove to be the Bitcoin’s partner in potential upside in the coming weeks.
Above the current price, the first resistance level is at $0.255, then the second at $0.263 and the third one at $0.277.
Below the current price, the first support level is at $0.235, then the second at $0.229 and the third one at $0.21.
The MACD on the daily chart shows a similar profile to that of Bitcoin. The MACD on the daily chart shows a similar shape to that of Bitcoin. The upward slope of the moving averages is optimal, and the distance to the indicator’s zero levels would allow it to reach the neutral zone with adequate speed to move into the upward area.
The DMI on the daily chart shows the two sides of the market-facing each other, both below the ADX line. Bears have a slight advantage over bulls at the moment.

