- XRP saw a small 2.67% increase today as it pushed above $0.22.
- The coin is now trading above the June 2020 high as it faces resistance at $0.225.
- Against Bitcoin, XRP is trying to push higher but is struggling with resistance at 2200 SAT.
XRP/USD – XRP Bulls Push To 2-Month Highs
Key Support Levels: $0.215, $0.21, $0.20.
Key Resistance Levels:$0.225, $0.235, $0.24.
XRP managed to push back above the $0.2 resistance last week and has been climbing higher ever since. The coin pushed above the 200-day EMA at $0.21 over the weekend, and it has continued until it reached the resistance at $0.225 (bearish .5 Fib Retracement) today.
This move toward $0.225 allowed XRP to create a fresh 2-month high as the bulls attempt to turn the market bullish. XRP would now need to fall and drop beneath $0.175 before being in danger of becoming bearish again.
XRP-USD Short Term Price Prediction
Looking ahead, if the bulls manage to overcome $0.225, resistance lies at $0.235, $0.24, and $0.255 (bearish .618 Fib Retracement).
On the other side, support is first expected at $0.215. Beneath this, added support lies at $0.21 (200-days EMA), $0.20, and $0.192 (.382 Fib Retracement level).
The RSI is above the 50 line to indicate bullish momentum, but it is quickly reaching overbought conditions. This could suggest the bulls need a break before continuing on the path higher.
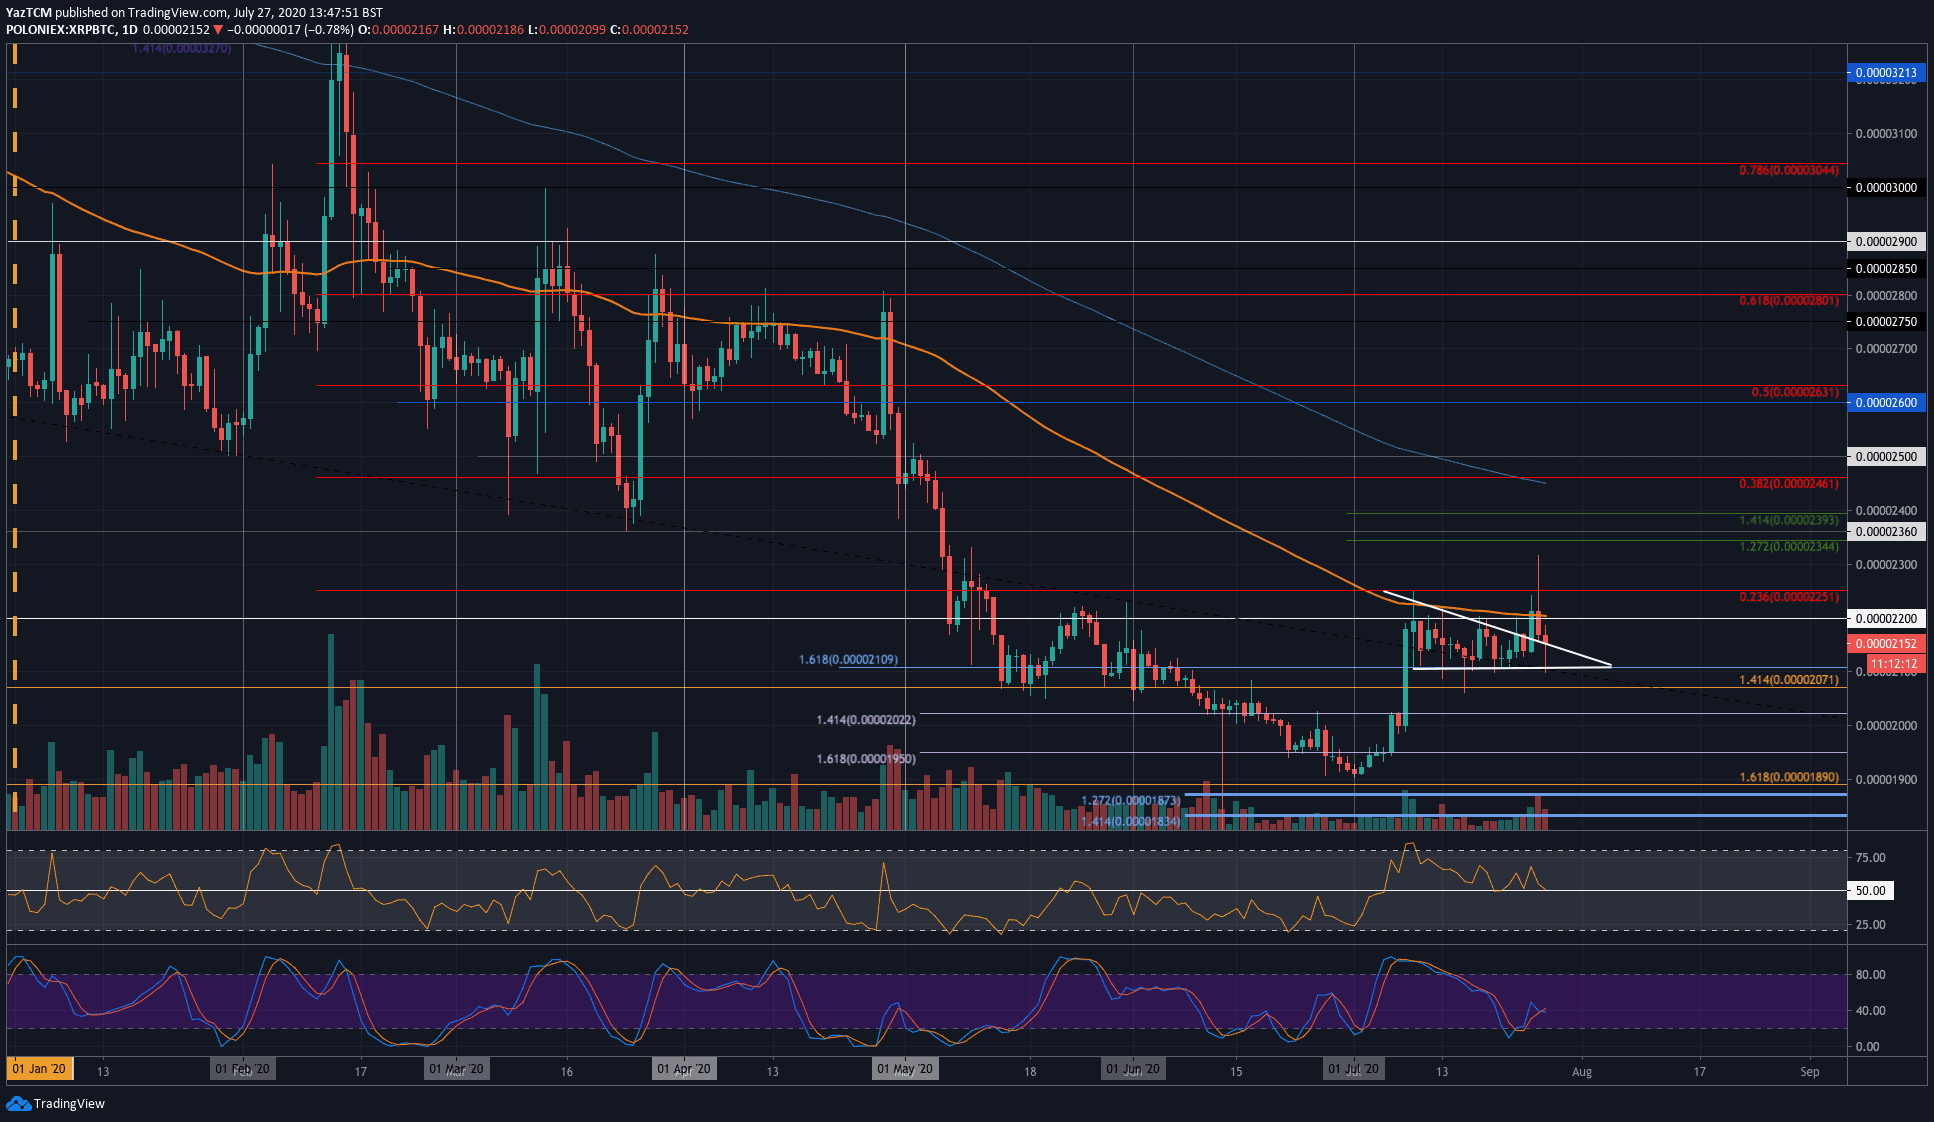
XRP/BTC – Bulls Battling To Break Triangle
Key Support Levels: 2100 SAT, 2071 SAT, 2050 SAT.
Key Resistance Levels: 2200 SAT, 2250 SAT, 2300 SAT.
Against BTC, XRP managed to rebound from 1900 SAT earlier in the month as it pushed toward the resistance at 2200 SAT. Since then, XRP has been unable to push higher as it formed an acute descending triangle pattern.
The XRP bulls attempted to push higher from this triangle over the weekend but were stalled by the resistance at 2200 SAT (100-days EMA). XRP has since dropped to 2150 SAT since reaching this resistance.

XRP-BTC Short Term Price Prediction
Moving forward, if the bulls can push above 2200 SAT, the first level of resistance lies at 2250 SAT (bearish .236 Fib Retracement). This is followed by added resistance at 2300 SAT, 2360 SAT, and 2460 SAT (bearish .382 Fib Retracement).
On the other side, the first level of strong support lies at 2100 SAT. Beneath this, added support is found at 2070 SAT, 2050 SAT, and 2000 SAT.
The RSI has dropped back into the 50 line, which indicates indecision within the market. So long as it remains above the 50 line, we can expect the bullish momentum to stay within the market.
Click here to start trading on BitMEX and receive 10% discount on fees for 6 months.
Disclaimer: Information found on CryptoPotato is those of writers quoted. It does not represent the opinions of CryptoPotato on whether to buy, sell, or hold any investments. You are advised to conduct your own research before making any investment decisions. Use provided information at your own risk. See Disclaimer for more information.
Cryptocurrency charts by TradingView.
