Disclaimer: The following article attempts to analyze the emerging patterns in the Litecoin short-term market and its impact on price.
Bitcoin’s price taking a downward route has forced most altcoins to similarly on the charts. Among these alts was Litecoin [LTC] which is also referred to as the digital silver. LTC lost 11% of its value over the past week and was currently being traded at $58.96. The coin has been facing extreme selling pressure, at press time, and lost nearly 5% of its value within three hours.
Source: LTC/USD on TradingView
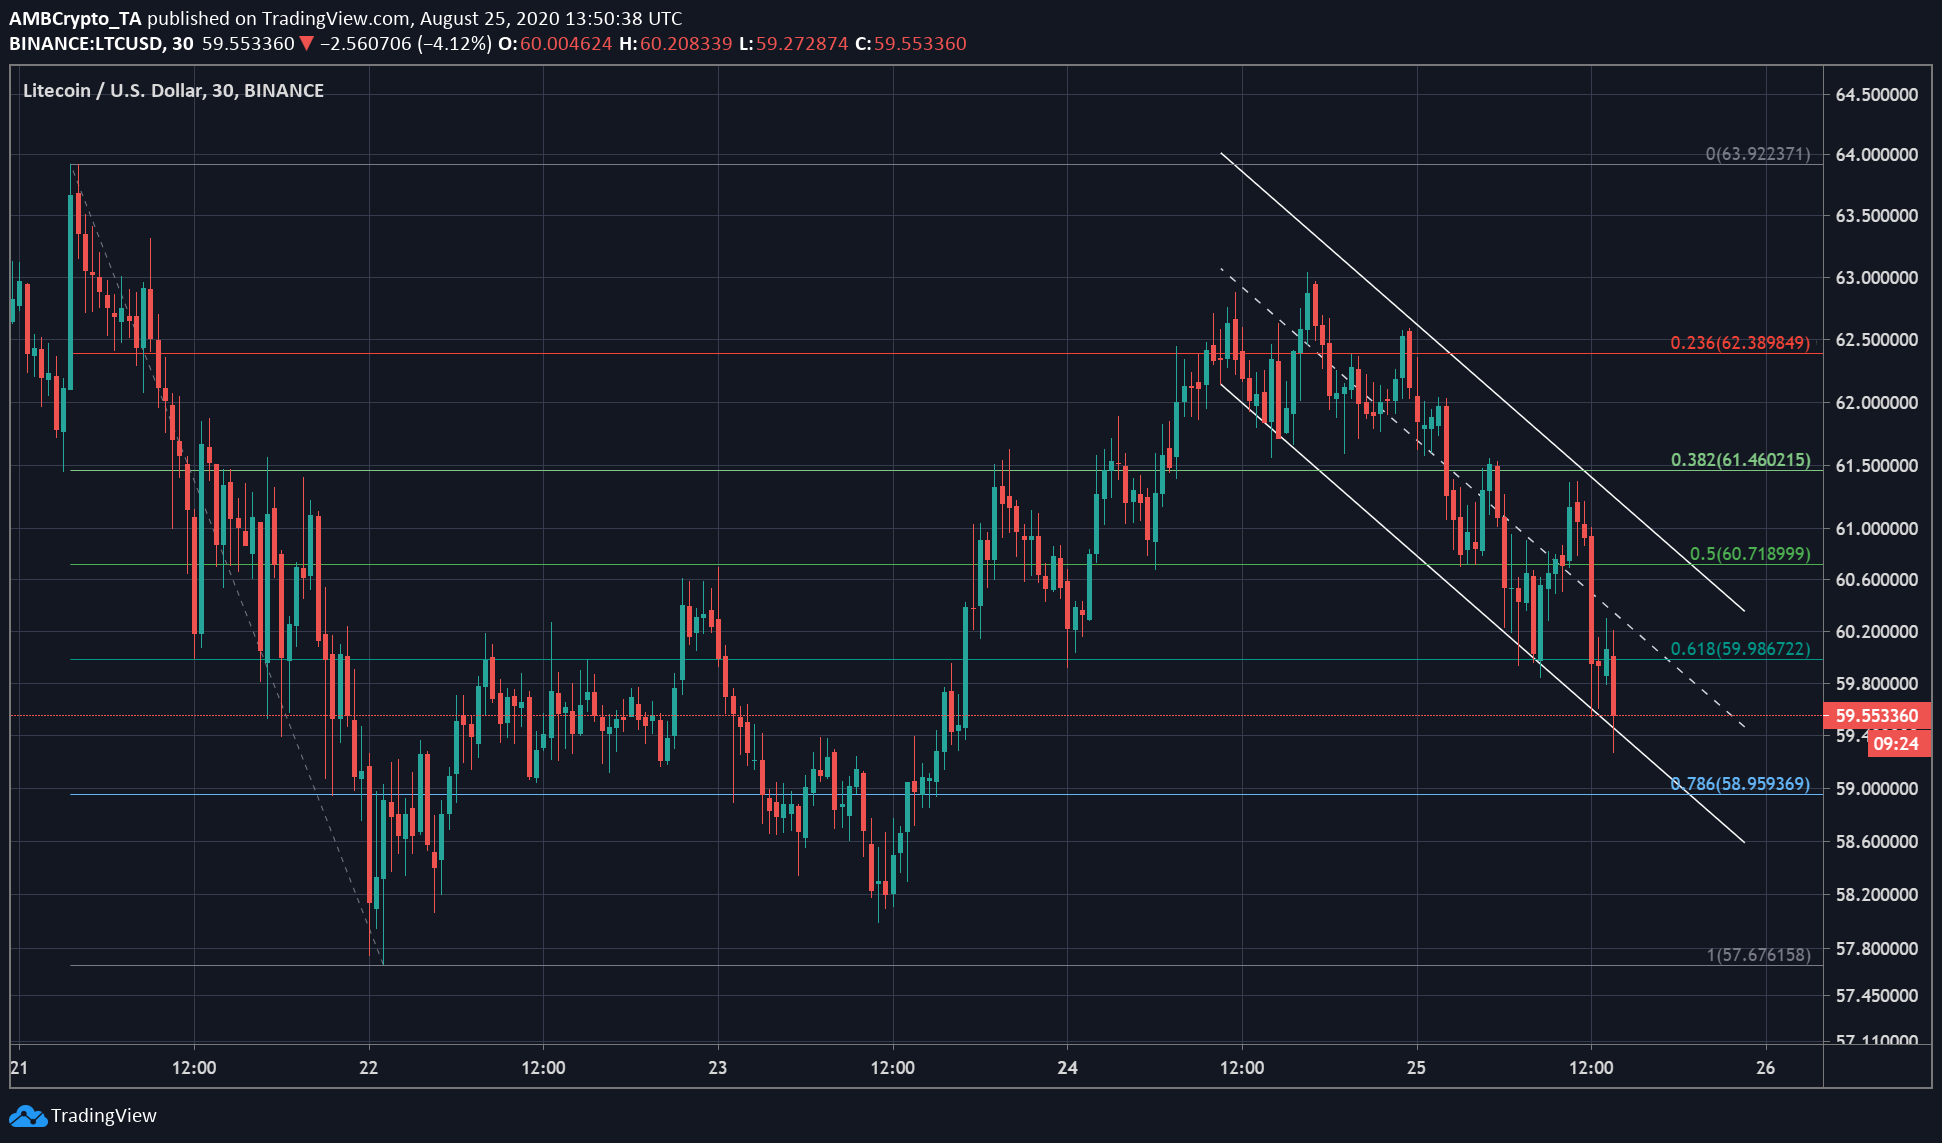
According to the hourly chart of LTC, the coin has been open to a lot of volatility, which was highlighted by the divergence of Bollinger Bands. This high volatility could put bearish pressure of the coin as it was falling down the descending channel and indicated at a bearish break down of LTC.
This bearishness in the market was made evident by the 50 moving average, which was well under the candlesticks during the rally, but has now moved above indicating a reversal in price trend. Whereas the signal line from Bollinger Bands also was positioned above the price bars, noting great selling pressure in the market.
Whereas, the Relative Strength Index was showing the implications of the current negative pressure in the market. The digital silver was on the cusp of being oversold, at press time. A dip under 30 will confirm that the digital asset had reached an oversold zone and may hint at a trend reversal taking place.

Source: LTC/USD on TradingView
As the price moved lower, LTC price may dip under $58.95, which was the immediate support. But the price will bounce back from this point, as it prepared to breach the immediate resistance at $59.98, in this particular period. However, the price may be able to witness a spike in the near future, but the resistance marked by the moving average was close to $61.46.
