
LTC/USD Price Technical Outlook
- Litecoin price chart highlights a trend-less move
- Positive outlook while above $62.20
Bulls Pullback From a Multi-Month High
Last week, Litecoin hit an over five-month high of $65.3. However, the price retreated after as some bulls seemed to cut back. This led a weekly candlestick to close in the red with a 1.7% loss.
Alongside that, the Relative Strength Index (RSI) abandoned overbought territory reflecting a weaker bullish momentum.
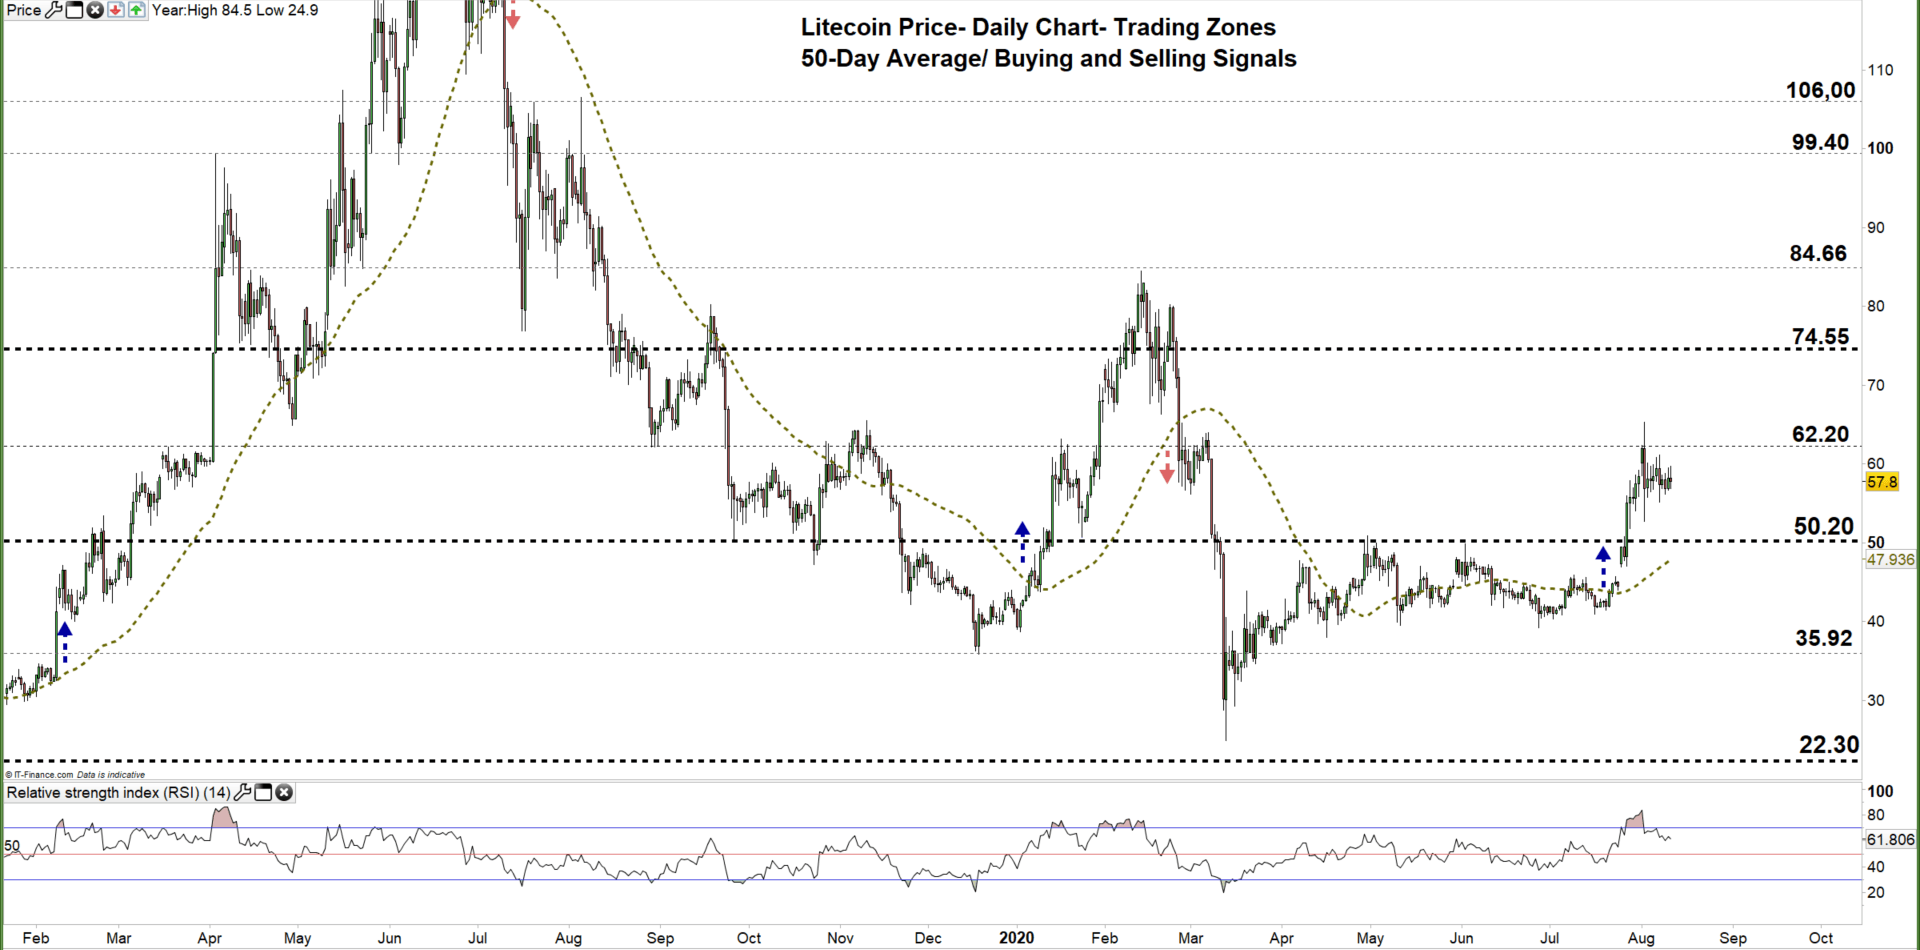
Litecoin PRICE DAILY CHART (FEB 1, 2019 – August 11, 2020) Zoomed Out

Recommended by Mahmoud Alkudsi
Traits of Successful Traders
Litecoin PRICE DAILY CHART (July 14 – August 11, 2020) Zoomed In

On July 27, Litecoin climbed to the current $50.20 – $62.20 trading zone, however, the price failed twice in early August to rally further indicating that bulls were losing momentum. Later on, the market started a sideways move creating a lower high with a higher low.
A daily close above the high end of the current trading zone may encourage bulls to rally Litecoin towards the monthly resistance level at $74.55 (July 2018 low).
On the other hand, a daily close below the low end of the zone may guide LTC/USD’s fall towards the monthly support at $35.92 ( December 2018 high).

Recommended by Mahmoud Alkudsi
Building Confidence in Trading
Litecoin PRICE FOUR Hour CHART (July 25 – August 11, 2020)
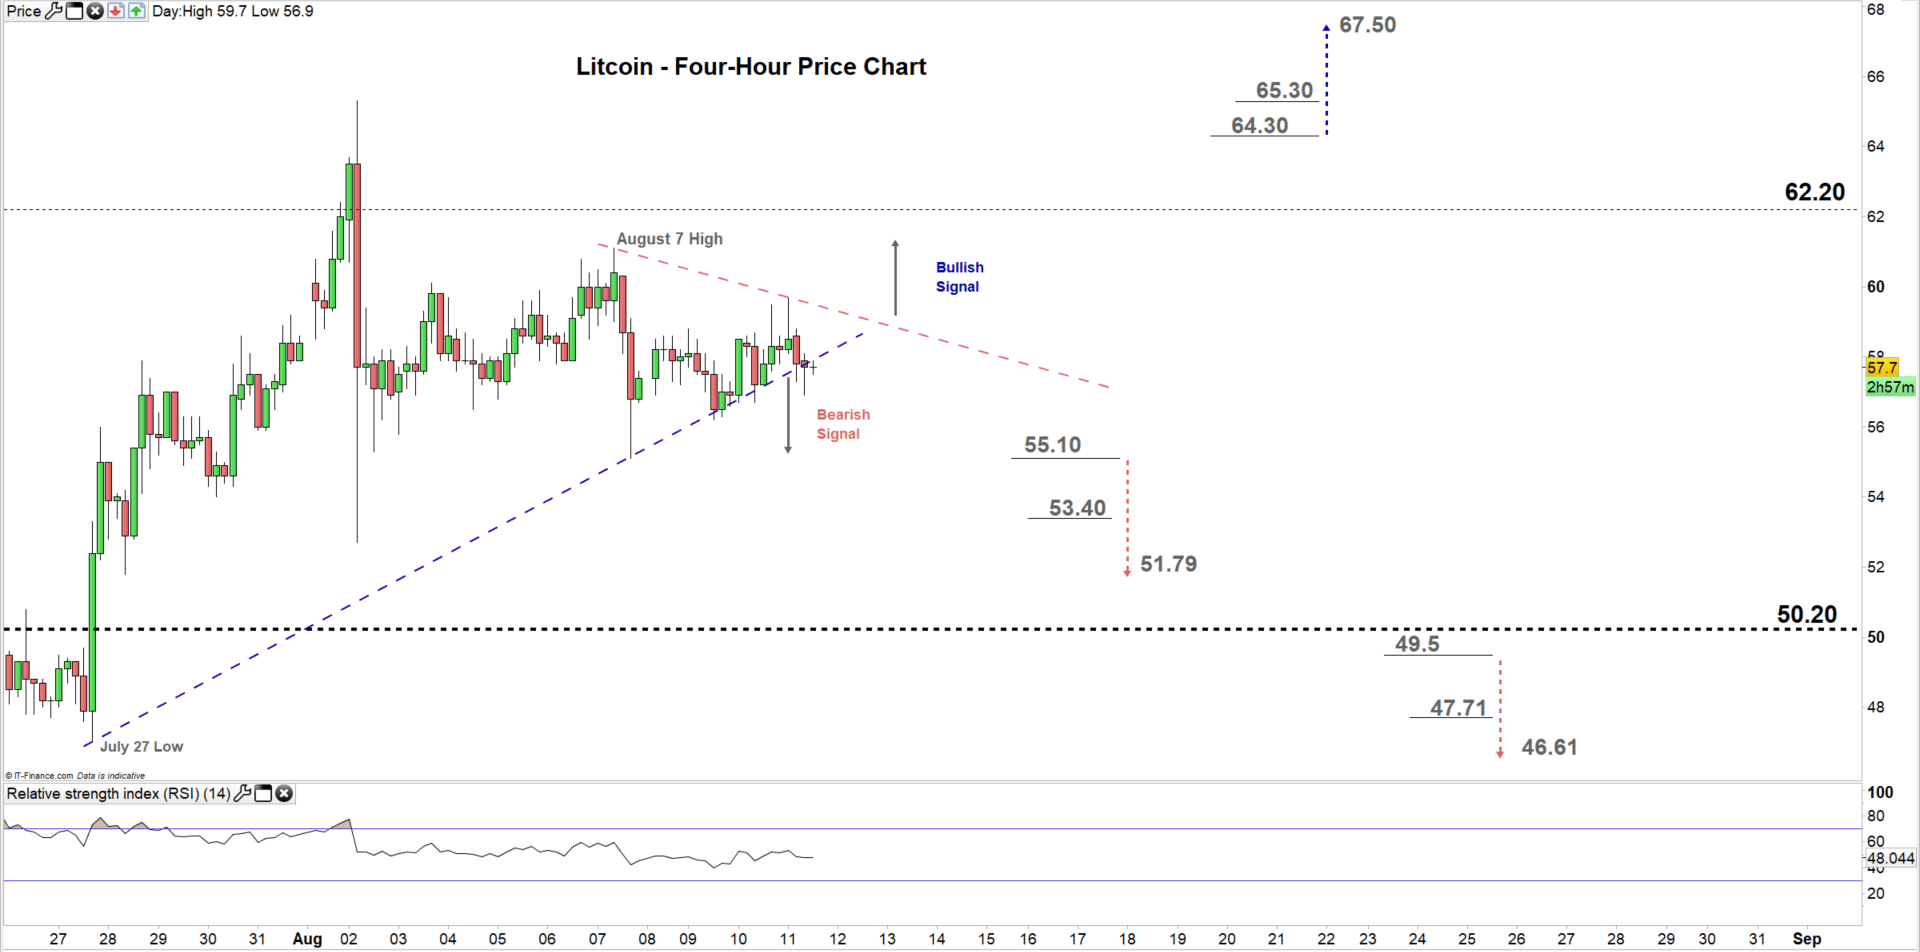
Today, the price has traded below the bullish trendline support originated from the July 27 low at $47.00 generating a signal in favor of bear’s control.
To conclude, while Litecoin’s outlook is neutral a break below $55.10 could send LTC/USD towards $51.79, while a break above $64.30 may trigger a rally towards $67.50. As such, the support and resistance levels underlined on the four-hour chart should be kept in focus.

Recommended by Mahmoud Alkudsi
Improve your trading with IG Client Sentiment Data
Written By: Mahmoud Alkudsi,Market Analyst
Please feel free to contact me on Twitter: @Malkudsi