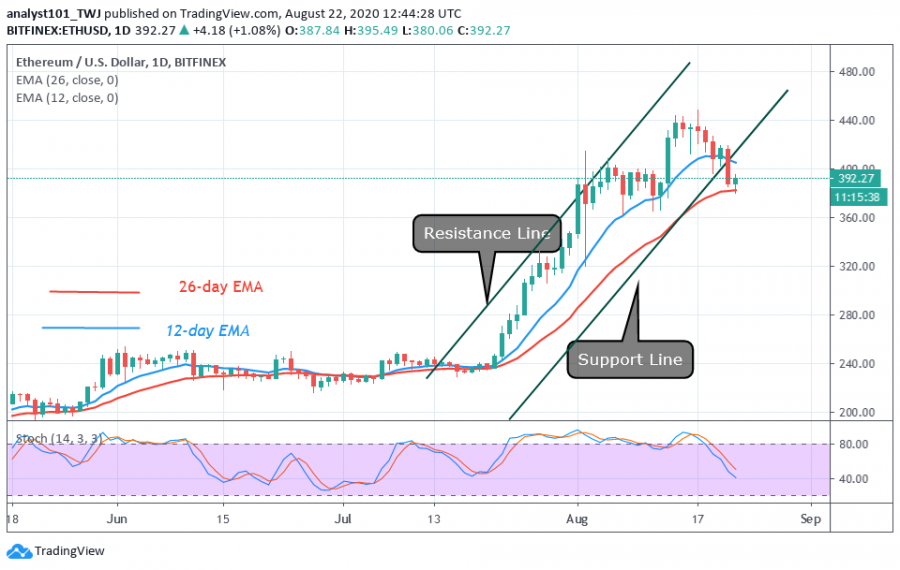
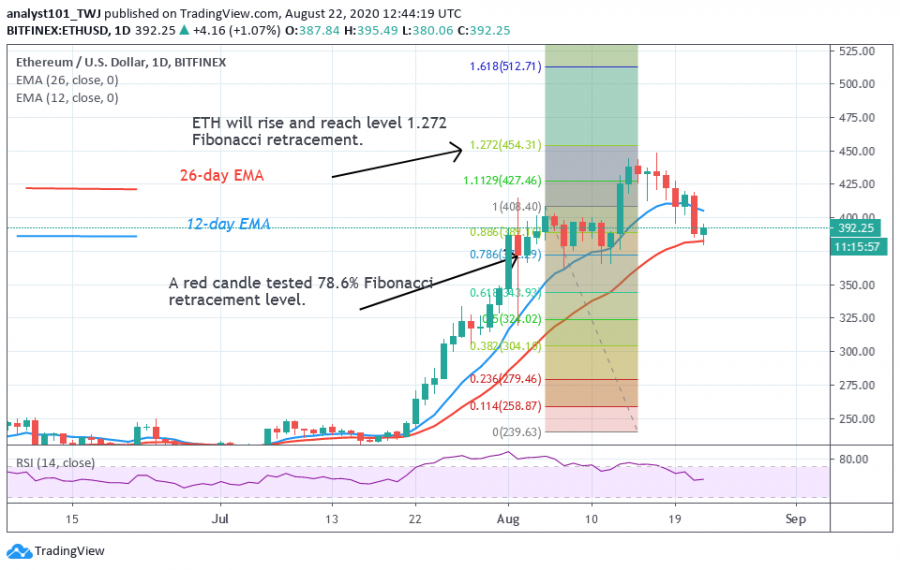
Ethereum is currently trading at $393 after sellers breached the crucial support level of $400. The crypto has earlier fallen to $380 and resumed an upward move.
The current support at $380 has been holding since August 1. On August 12, the biggest altcoin rebounded above it and reached the $440 overhead resistance. Today, at the same support, the price action is indicating bullish signals. This is an indication that the selling pressure has subsided and that buyers are taking control of prices.
Ether has another chance to resume the uptrend, if price rebounds above the current support, the momentum will push the price upward. Buyers will attempt to retest the $440 resistance. Ethereum will make a further upward move if the bulls clear a $440 resistance level. Otherwise, Ether will be compelled to move sideways below the resistance.
Ethereum indicator analysis
Given the recent downtrend, Ether is below 80% range of the daily stochastic. However, the bearish momentum has been overtaken by price action bullish signals. ETH price is above 26-day EMA. The crypto will rise if the 26-day EMA support holds if not a downward move will prevail.

Key Resistance Zones: $220, $240, $260
Key Support Zones: $160, $140, $120
What is the next direction for Ethereum?
The biggest altcoin is resuming an upward move after the recent downtrend. The upward move will retest $440 resistance to break it. Failure will propel price to a sideways move. When the market retests the $440 resistance, the Fibonacci levels will be created to determine the next target. In the interim, analysts believe that Ether will reach a high of $480.

Disclaimer. This analysis and forecast are the personal opinions of the author that are not a recommendation to buy or sell cryptocurrency and should not be viewed as an endorsement by CoinIdol. Readers should do their own research before investing funds.
