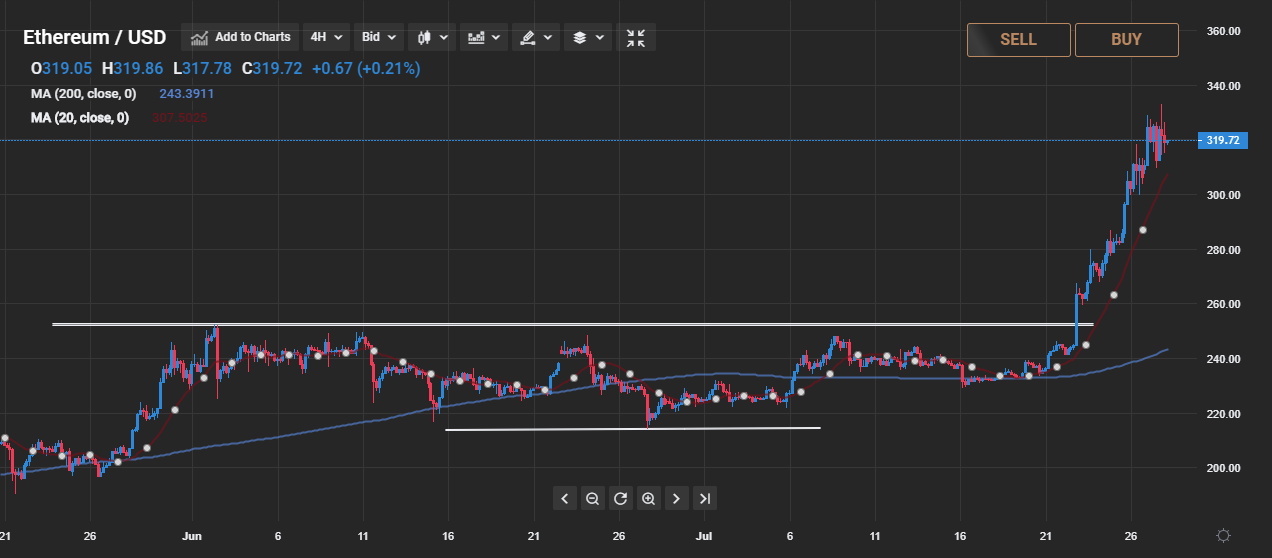
Ethereum staged a major technical breakout last week, after the second largest cryptocurrency rallied past the $300 resistance level, hitting a new multi-month and 2020 trading high.
Ethereum price analysis shows that the cryptocurrency could now start to rally towards the 2019 trading high, around the $365 level.
ETH/USD medium-term price trend
The ETH/USD pair performed a major technical breakout last week, due to positive fundamental developments surrounding the cryptocurrency.
Ethereum also benefited from its nearest rival Bitcoin staging a rally above the psychological $10,000 level.
Ethereum technical analysis shows that a major technical breakout took place after bulls moved the price above the $300 level.
The daily time frame shows that a bullish inverted head-and-shoulders pattern has been activated.
According to the size of the bullish reversal, the ETH/USD pair could rally towards the $480 level.
Due to the bullish trend shift in the ETH/USD, traders are likely to buy any dips towards the $300 to $290 area in anticipation of further medium-term gains.
ETH/USD short-term price trend
Ethereum technical analysis shows that the cryptocurrency has a short-term bullish bias while the price trades above the $270 level.
The four-hour time frame currently shows that bulls have moved the cryptocurrency back inside a rising price channel.

ETH/USD bulls need to maintain the price above the $270 level to encourage buying towards the top of the rising price channel, around the $420 level.
According to the size of the price channel, the ETH/USD pair could rally by a further $100 from current levels.
Traders should note that if the ETH/USD pair moves under the $290 level, sellers may try to attack towards the bottom of the channel, around the $270 level.
ETH/USD technical summary
Ethereum technical analysis shows that the ETH/USD pair has staged a major technical breakout. Sustained gains above the $300 level will confirm a major bullish shift.
