- The Altcoin segment is boiling hot, laying the foundations for a massive bull market.
- Despite the apparent calm on the surface, Cardano, Chainlink or Ripple knock hard on the heavens’ door.
- The war for dominance distracts Bitcoin and Ethereum, focused on the power play.
The Crypto market appears like a calm sea if you look at it from the surface, but under that first layer of tranquillity, there are very significant movements.
The war for dominance is at a high point where Bitcoin desperately struggles to stay above the current support. Technical indicators are pointing to a continuation of the downtrend, although RSI below the 20 levels is signaling bounces in the short term from the strong oversold.
Ethereum is once again falling below the resistance level that gives way to the bullish scenario. Technical indicators are not giving up on the breakout attempt, so we may continue to see Ethereum doing better than Bitcoin in the coming days.
In the second level Altcoin segment, things are very much in the air with Cardano (ADA) as the guest star of the show. Today, Ethereum’s rival rises more than 23% and chains up several days with an accumulated price increase of more than 65%. The weekly chart for the ADA/USD pair provides useful information. Cardano left the bearish scenario at the end of May in which it moved since July 2019 – now recovering the upward trend that began in December 2018.
If ADA/USD consolidates at this price, the next target is the $0.30 level (+360%).
Ripple also stands out today on the positive side with a 7.8% rise on the day, leaving it on the verge of the $0.20 level and, as we will see in the detailed analysis, an option to return to the glory of times past.
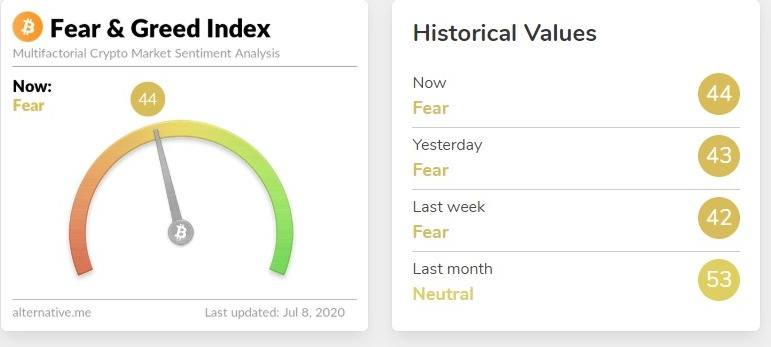
The market sentiment remains, despite all the above, in a fear zone by leaving the score today at level 44, according to the site alternative.me.
The market expects double-digit increases in Bitcoin and Ethereum, reminiscent of old times. Still, the maturity of Bitcoin and Ethereum may no longer allow for such gains.
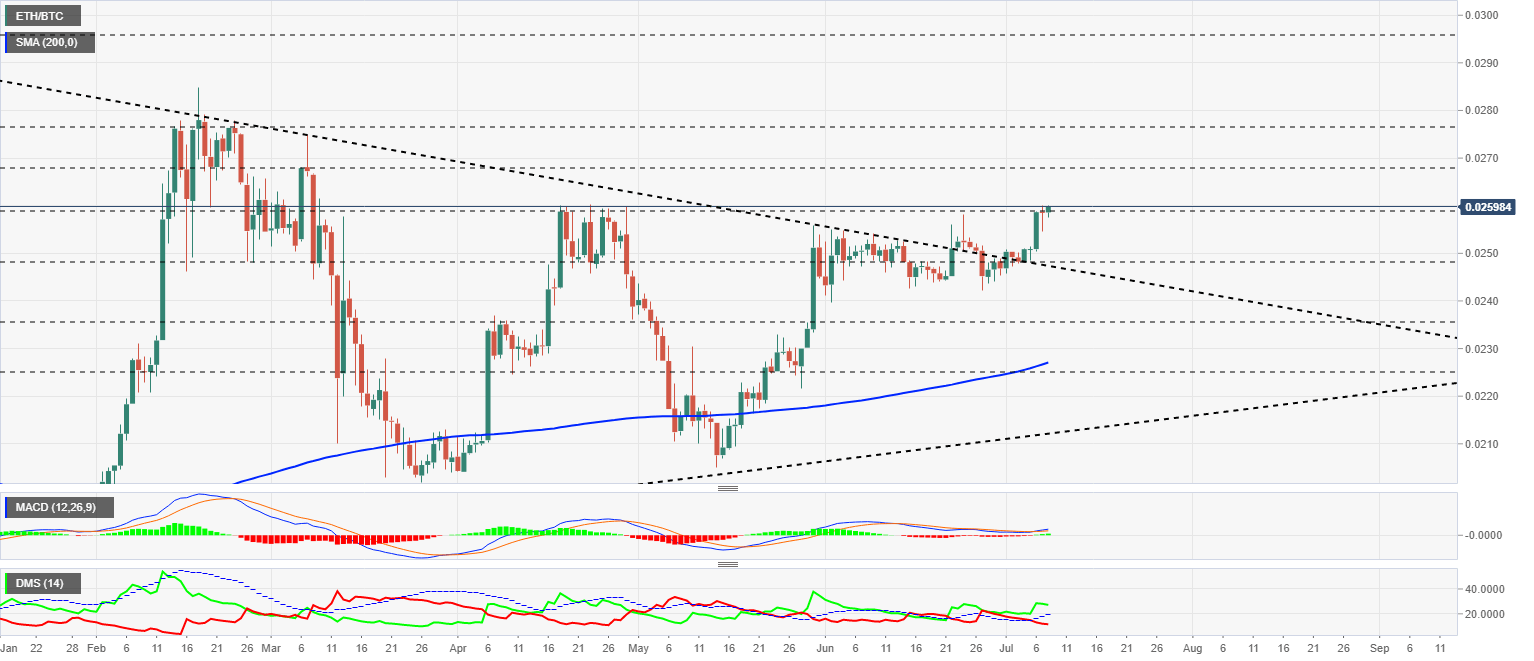
ETH/BTC Daily Chart
The ETH/BTC pair is currently trading at the price level of 0.02598 and continues to gain height, now heading towards the next resistance level at 0.0268. The 200-day moving average is accelerating upwards and confirms the improvement in the ETH/BTC’s upward momentum.
Above the current price, the first resistance level is at 0.0268, then the second at 0.0276 and the third one at 0.0295.
Below the current price, the first support level is at 0.0248, then the second at 0.0267 and the third one at 0.0276.
The MACD on the daily chart continues to show a bullish cross but with little increase in the distance between the moving averages.
The DMI on the daily chart shows the bulls dominating as the bears continue to retreat and give all the play to the buying side.
BTC/USD Daily Chart
The BTC/USD pair is currently trading at the price level of $9288 and remains in the attack zone of the $9500 congestion resistance. The 200-day simple moving average is leaning decisively higher, supporting the next move to the $11000 level.
Above the current price, the first resistance level is at $9500, then the second at $10450 and the third one at $11400.
Below the current price, the first support level is at $8900, then the second at $8750 and the third one at $8425.
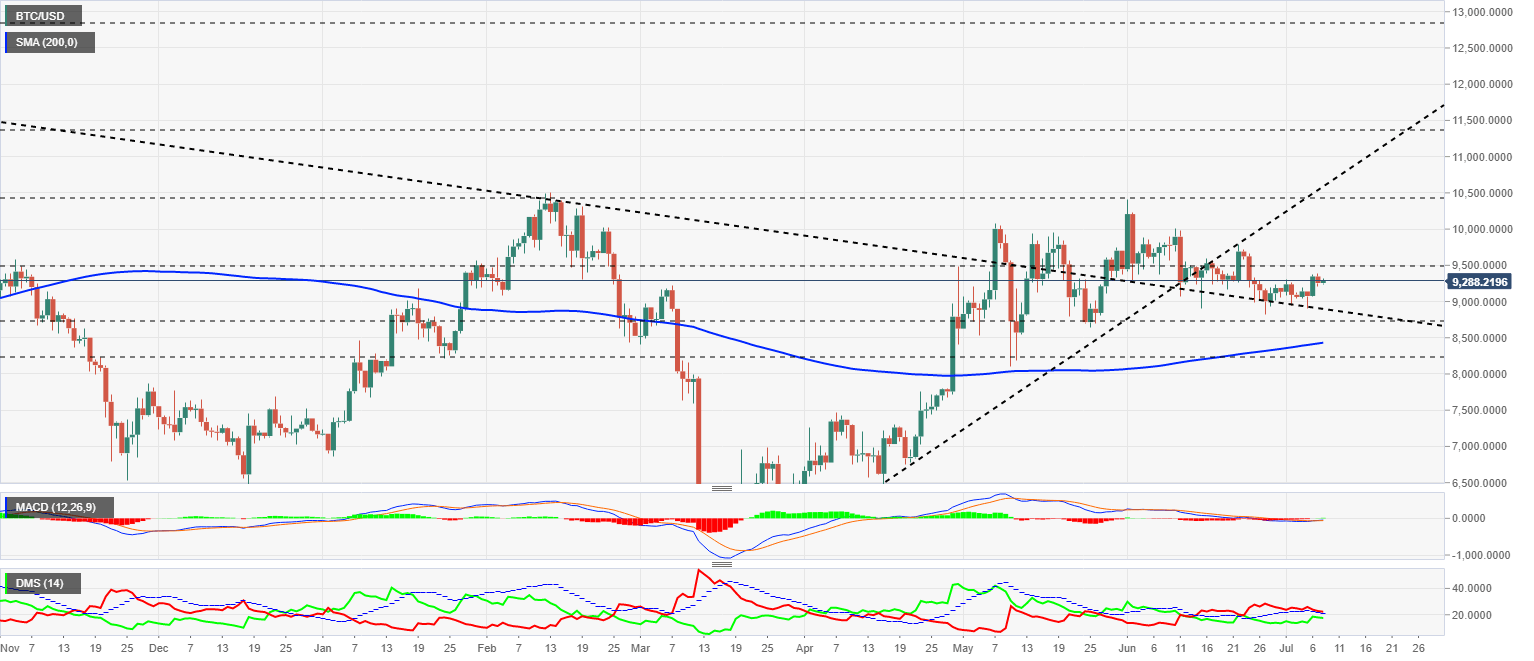
The MACD on the daily chart maintains the bullish cross but faces the indicator’s zero levels if it wants to go back up powerfully.
The DMI on the daily chart shows bears at risk of a downward breach of the ADX line. The bulls are holding the recent upside and are getting very close to the sell-side so that they could take the lead quickly.
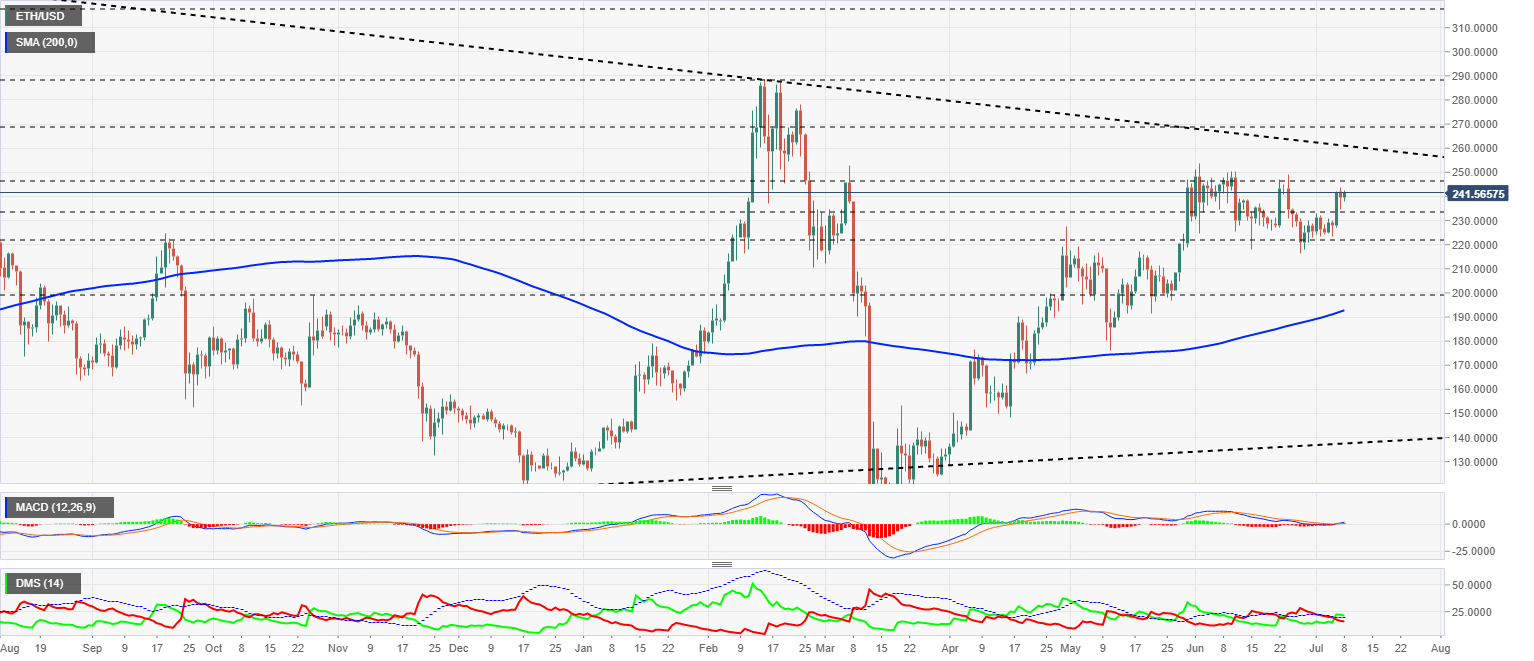
ETH/USD Daily Chart
The ETH/USD pair is currently trading at the price level of $241.5 and is still waiting for the right moment to strike and break the critical level at $260.
Above the current price, the first resistance level is at $245, then the second at $261 and the third one at $270.
Below the current price, the first support level is at $232, then the second at $221 and the third one at $200.
The MACD on the daily chart is rising again after finding ground at the neutral level, a classic bullish continuation pattern.
The DMI on the daily chart shows the bulls are leading the ETH/USD pair, but not yet close enough to dominate it. The bears are moving downward, but without speed, so they may still try to take control of Ethereum’s price action.
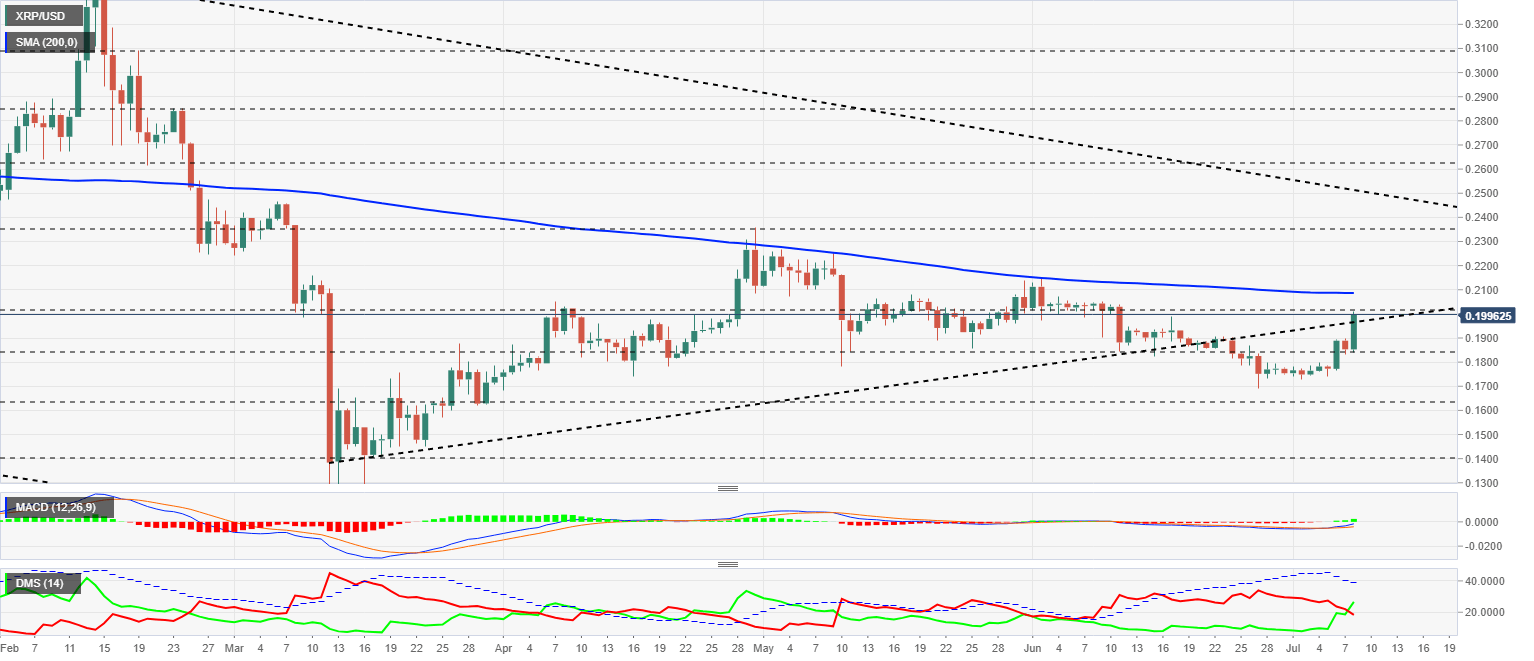
XRP/USD Daily Chart
The XRP/USD pair is currently trading at the price level of $0.1996 and has surprisingly recovered from the previous bullish scenario, which originated from the March lows. The 200-day simple moving average is trading at $0.21 and shows a horizontal upward sloping profile, not seen since the relative highs of mid-February.
Above the current price, the first resistance level is at $0.20, then the second at $0.21 and the third one at $0.237.
Below the current price, the first support level is at $0.185, then the second at $0.165 and the third one at $0.14.
The MACD on the daily chart extends the bullish cross and is heading towards the indicator’s zero levels, where the potential for the upward movement that began three days ago will become clear.
The DMI on the daily chart shows the bulls leading the pair for the first time since the second week of May. The bears are moving fast downwards but are still a significant trend strength levels.

 (2)-637297965090744163.png)
