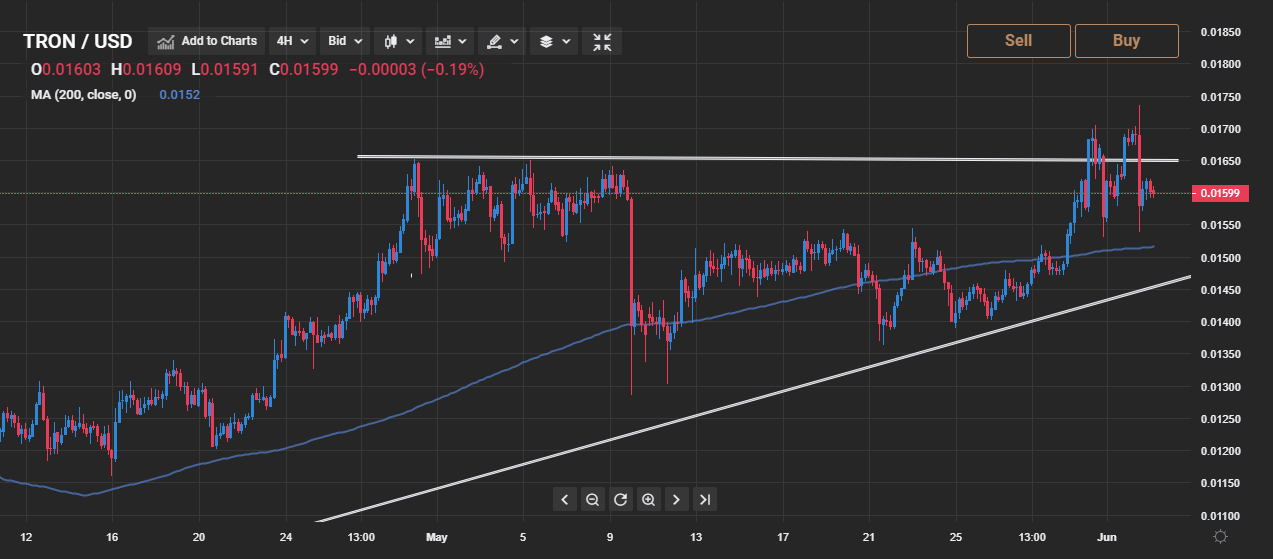
TRON technical analysis shows that the TRX/USD pair is likely to test above the psychological $0.020 resistance level.
TRON medium-term price trend
After weeks of sideways trading action TRON is finally starting to rally this week due to increased buying demand for altcoins.
TRON price analysis shows that the cryptocurrency could rally towards the $0.028 level if the $0.020 resistance level is broken.
The daily time frame shows that the TRX/USD pair is trading within a descending triangle pattern.
A breakout above the top of the descending triangle pattern could cause the TRX/USD pair to rally towards the $0.028 level.
The 50 per cent and 61.8 Fibonacci retracement levels of the current 2020 high to the 2020 low, around the $0.024 and $0.028 levels, are the likely upside targets over the medium term.
TRON short-term price trend
The TRX/USD pair has a short-term bullish bias while the price trades above the $0.014 level.
TRON technical analysis shows that a bullish breakout from an inverted head-and-shoulders pattern has taken place.

The neckline of the inverted head-and-shoulders pattern is located close to the $0.016 level. Price has already broken through neckline resistance earlier this week.
Technical analysis shows that the implied bullish target of the pattern would take the TRX/USD pair towards the $0.021 level over the short term.
TRON technical summary
TRON technical analysis shows that the cryptocurrency is likely to test towards the $0.020 resistance area. Bulls may be targeting the $0.028 resistance level over the medium term.
