BSV/USD, BNB/USD and TRX/USD have recently experienced significant pullbacks after dipping to weekly lows
Most altcoins are trading lower today as Bitcoin breaks below $9,400 despite huge interest from retail investors and accumulation by whales in the macro sense.
BSV/USD
Bitcoin SV climbed from lows of $169 to intraday highs of $175 yesterday. However, bulls failed to keep the uptrend and settled on $172 at the close. With 1.69% in reported losses on the day, the movement suggests a lack of buyer appetite.
On weekly charts, BSV/USD has stayed below the 20-day EMA and the RSI is also pointing south, keeping sentiment in bear territory.
Bulls need to prevent a break of the immediate support zone at $170–$165 to stem an extended downtrend. A drop beyond this level opens up $146 and below that, prices could test lows of $120.
Conversely, if prices cross above the moving average and push beyond the 20-day EMA, then a run to the highs of $200 is likely.
BNB/USD
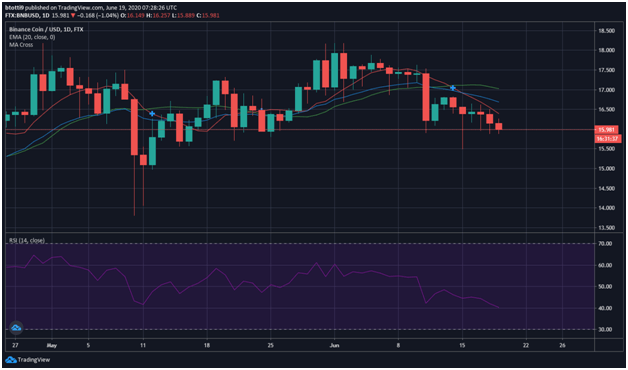
Binance Coin price dipped to lows of $15 earlier in the week before bulls staged a comeback to push the it to highs of $18.
However, Binance Coin ran into strong resistance at $18, with sellers rejecting the challenge to push prices back to lows of $16.
Presently, the BNB/USD pair is trading at $16.05 below the MA cross at $16.33 and $17.09. Prices are also cutting below the 20-day EMA that is providing the first major hurdle of the upside.
Prices need to break above this level to check another rejection that might provide a springboard for sellers to look at a run for new lows. A bounce would be helped by major support at the foot of the moving averages, so if bulls invalidate the current downtrend, demand at the dip could allow for a retest of higher levels.

RSI is negative, suggesting a likely breakdown to the lows of $15.72 hit on June 15 at the beginning of the week.
TRX/USD
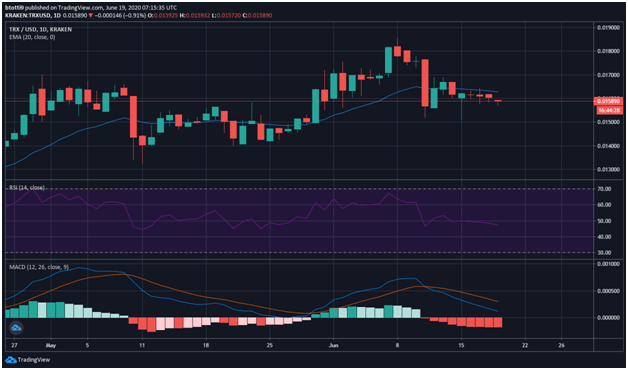
On June 8, Tron’s price hit a monthly high of $0.0185. A downtrend that has coincided with a dip in altcoins has seen a drop to lows of $0.0152, last seen on May 30.
After rallying to highs of $0.0170 on June 17, the past 24 hours have seen its value against the US dollar slip 1.4%.
TRX/USD price has thus broken past two key support zones at $0.0165 and $0.0170. It’s also trading near the bottom of the 23.6% Fibonacci retracement level formed at $0.0185 highs and $0.0150 lows on the downward channel.

On the technical side, the MACD on the 4-hour chart indicates a bearish outlook is forming. The RSI is also in negative territory. Key support zones are at $0.0155 and $0.0150, while any upside might be capped at $0.0168 and $0.0170 short term.
