
- XRP saw a small 1.5% price drop over the past 24 hours as it fell to $0.184.
- The cryptocurrency has returned to the lower boundary of a descending triangle and looks to be headed beneath.
- Against Bitcoin, XRP dropped beneath 2000 SAT to reach 1950 SAT and creates fresh lows for 2020.
Key Support & Resistance Levels
XRP/USD:
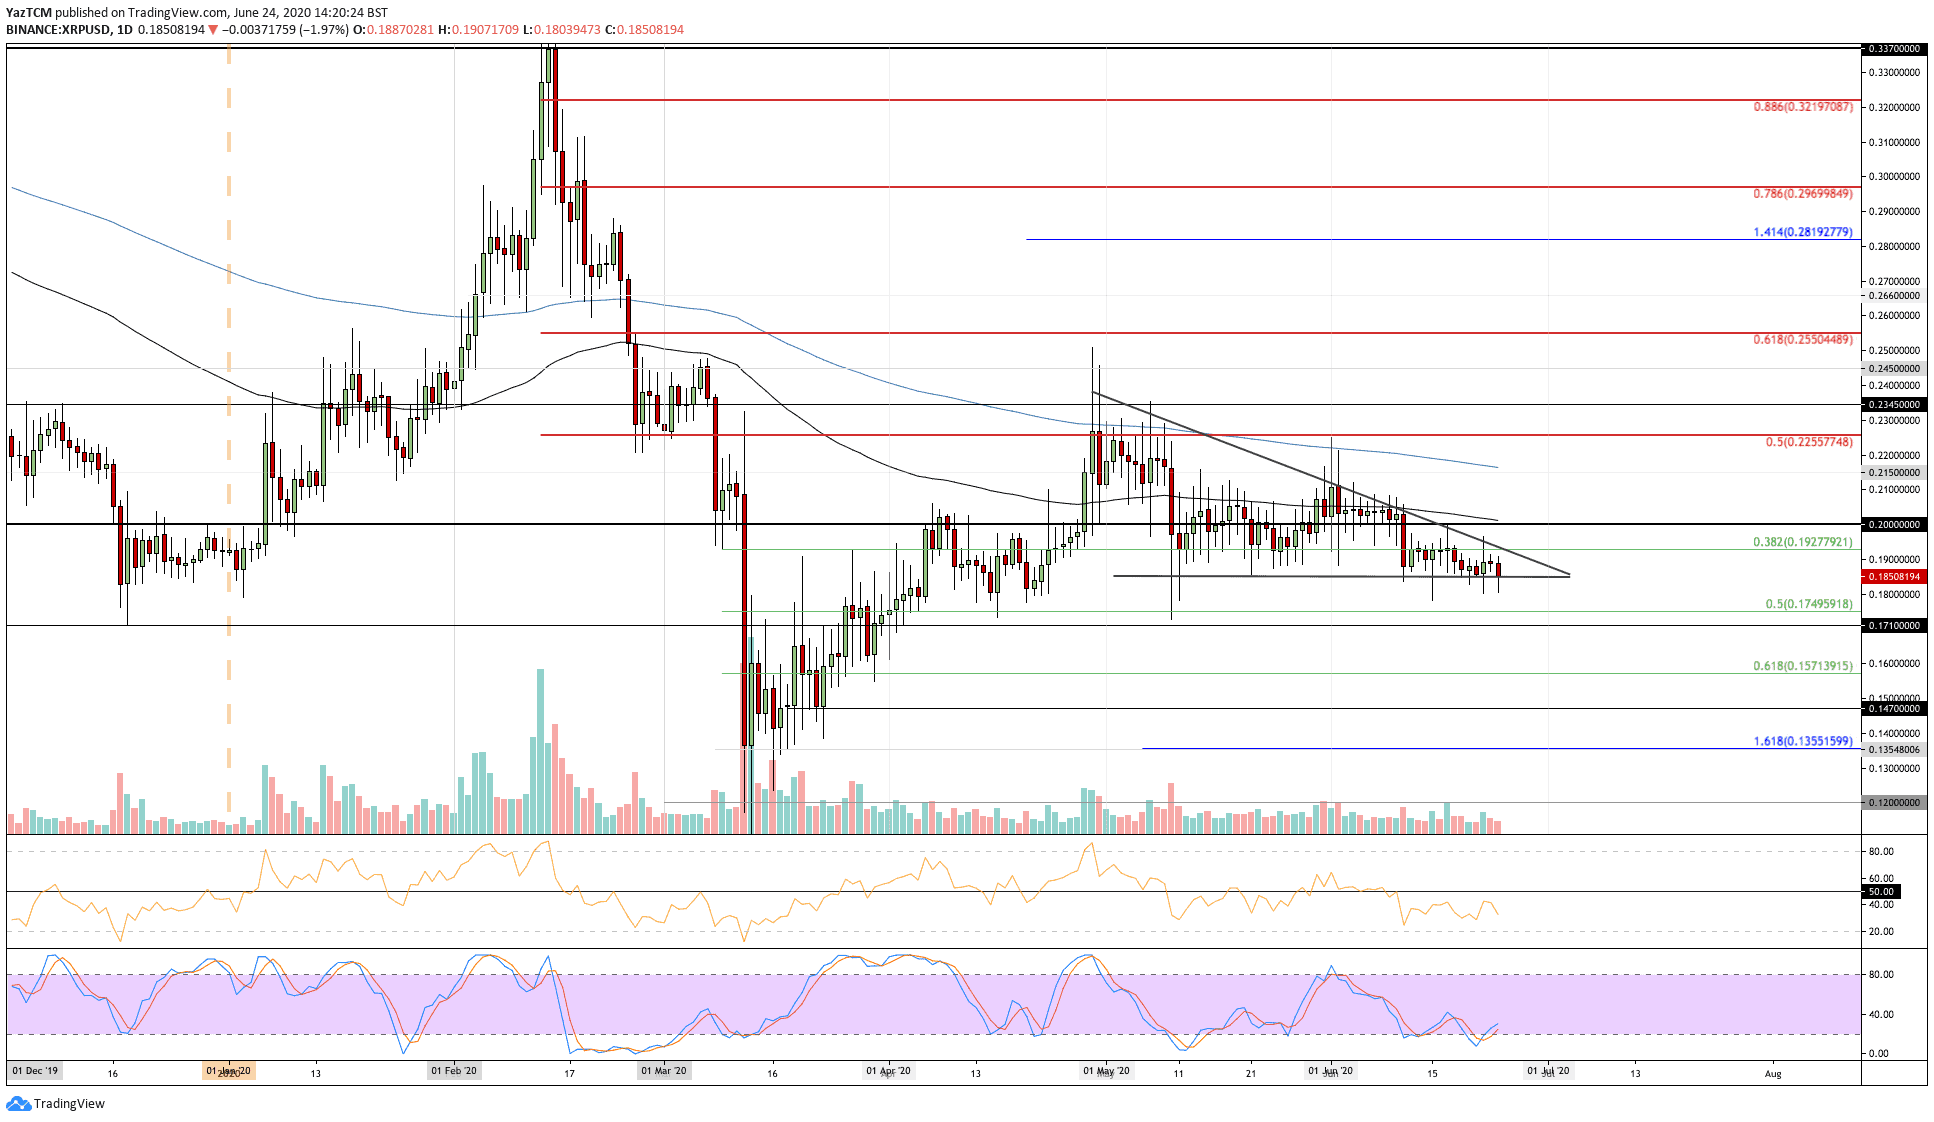
Support: $0.175, $0.171, $0.157.
Resistance: $0.192, $0.20, $0.207.
XRP/BTC:
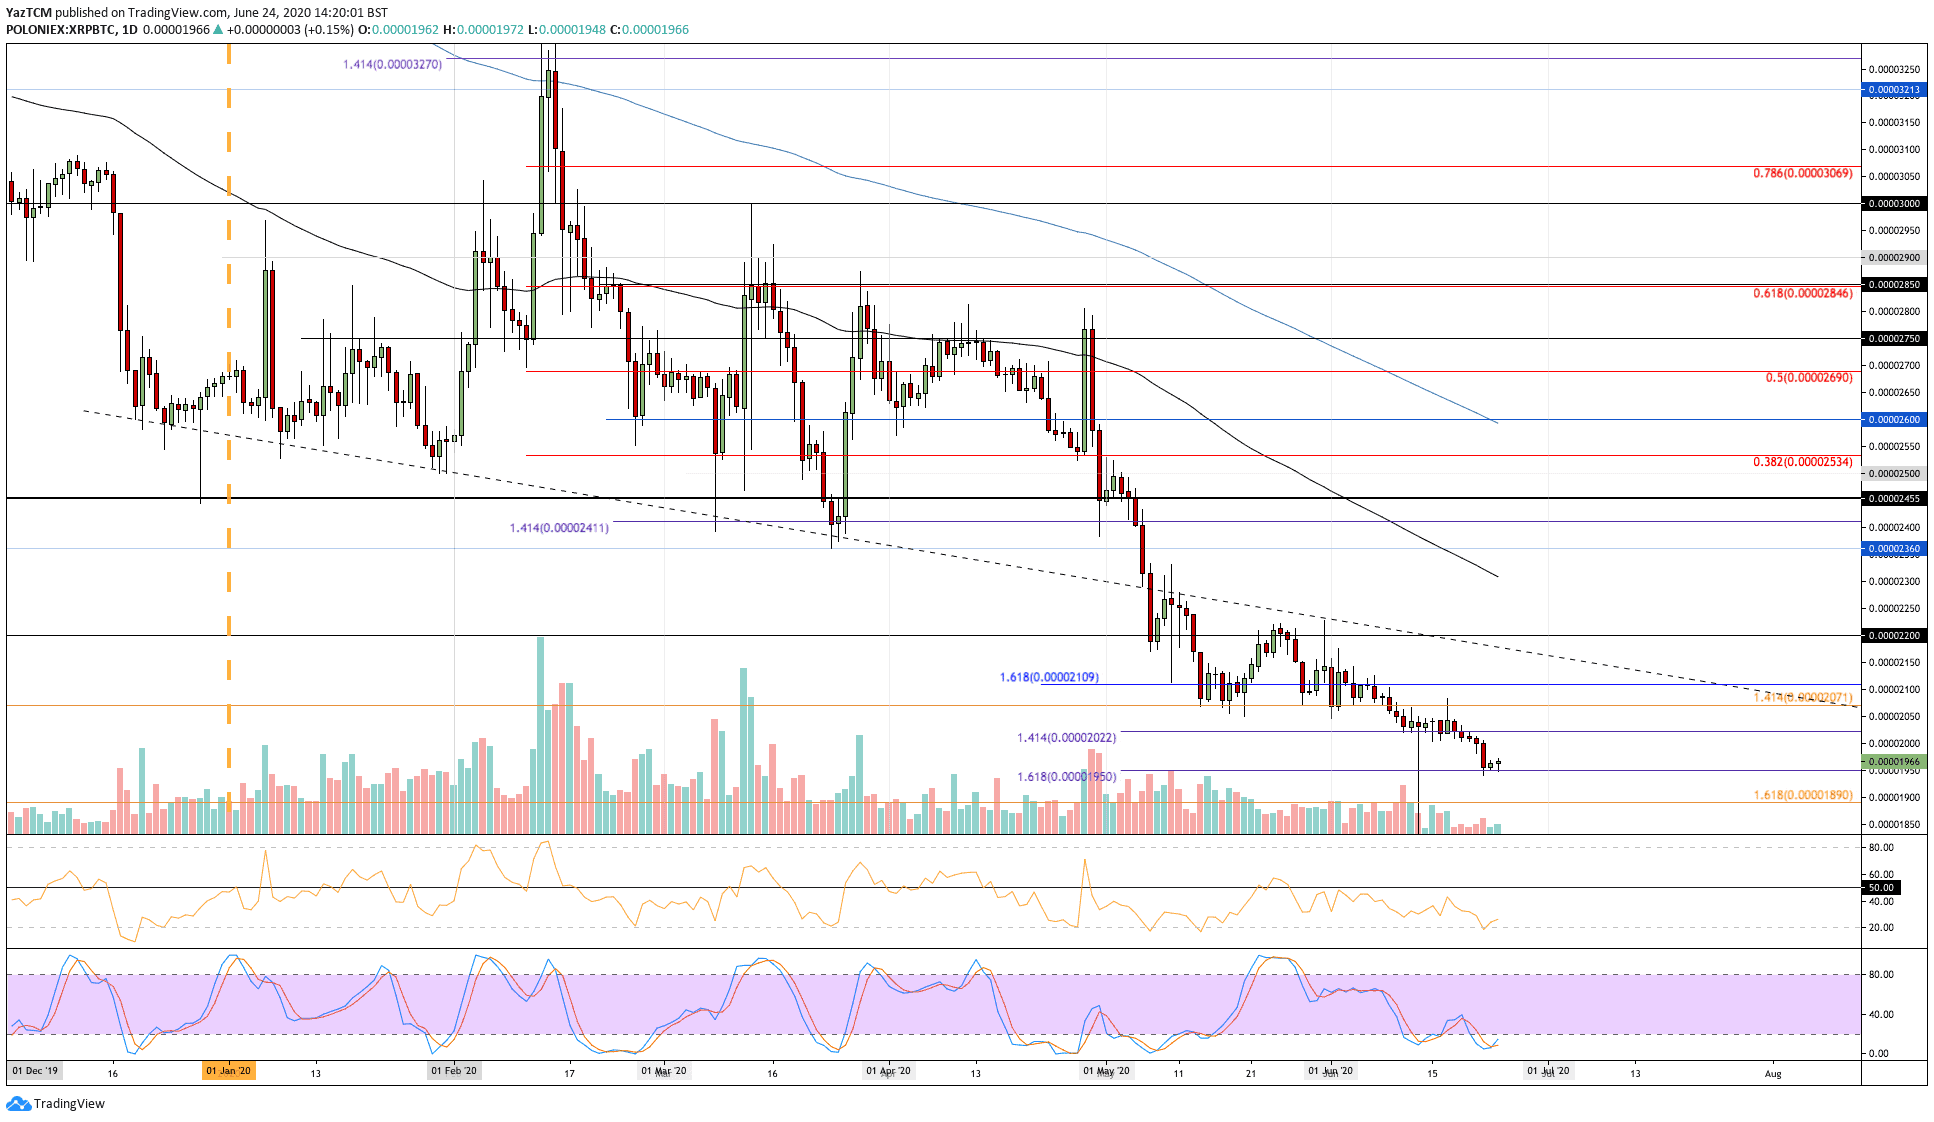
Support: 1950 SAT, 1900 SAT, 1890 SAT.
Resistance: 2022 SAT, 2050 SAT, 2100 SAT.
XRP/USD: XRP Bulls Battling To Defend Triangle
XRP returned to the lower boundary of the triangle today as the buyers battle to keep the price above it. The cryptocurrency has struggled to break the resistance at $0.192 all week, which caused it to head lower into the $0.185 level.
A break beneath this triangle could result in XRP unwinding toward the $0.16 level again. Typically, the descending triangle breaks toward the downside, and this is looking increasingly likely in the case of XRP.
XRP-USD Short Term Price Prediction
Looking ahead, if the sellers break beneath the triangle, then the first level of support lies at $0.175 (.5 Fib Retracement). Below this, added support lies at $0.171 and $0.157 (.618 Fib Retracement).
On the other side, the first level of resistance lies at $0.192 at the upper boundary of the triangle. Higher resistance is expected at $0.20 (100-day EMA) and $0.21.
The RSI is well beneath the 50 line to indicate the sellers dominate the market momentum. For recovery, the RSI must rise and push above the 50 line. However, the Stochastic RSI recently produced a bullish crossover signal in oversold conditions that could help to send XRP higher.
XRP/BTC: XRP Creating Worrying Fresh 2020 Lows
Against Bitcoin, XRP continued its dire scenario this week after falling beneath the 2000 SAT level and dropping as low as 1950 SAT. The support here is provided by a downside 1.618 FIb Extension level, and a drop beneath it could see XRP falling further down the market cap rankings.
XRP is now trading at a low that has now been seen since December 2017 and must start to show signs of recovering to attract some new attention.
XRP-BTC Short Term Price Prediction
If the sellers push XRP further beneath 1950 SAT, support can be found at 1900 SAT, 1890 SAT, and 1850 SAT.
On the other side, resistance lies at 2022 SAT, 2071 SAT, and 2100 SAT.
The RSI is in the bearish territory as it trades beneath 50. A push toward the 50 line would indicate weakening selling pressure, which could allow for the bulls to slide in and push XRP back above 2000 SAT.
Click here to start trading on BitMEX and receive 10% discount on fees for 6 months.
Disclaimer: Information found on CryptoPotato is those of writers quoted. It does not represent the opinions of CryptoPotato on whether to buy, sell, or hold any investments. You are advised to conduct your own research before making any investment decisions. Use provided information at your own risk. See Disclaimer for more information.
Cryptocurrency charts by TradingView.