Litecoin is struggling to find a meaningful trading bias, as the broader cryptocurrency market continues to consolidate.
Litecoin price analysis shows that a falling wedge pattern dominates the medium-term outlook on the daily chart.
Litecoin medium-term price trend
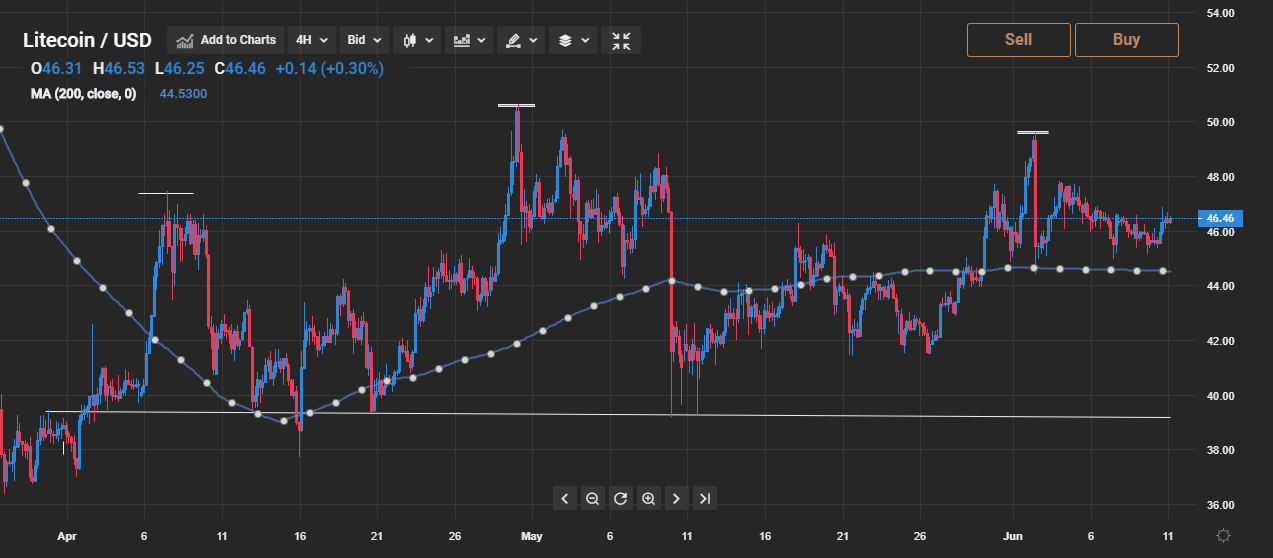
Litecoin has been trapped between the $40.00 to $50.00 price range for over five-weeks, as the LTC/USD pair continues to lack a clear price trend.
Litecoin technical analysis shows that a bullish falling wedge pattern continues to dominate the medium-term out of the LTC/USD pair.
The daily time frame shows that the cryptocurrency is trading within a falling wedge pattern between the $38.00 to $54.00 levels.
According to the size of the falling wedge pattern, the LTC/USD could rally towards the $80.00 level if a breakout above the $54.00 level takes place.
Failure to overcome the $54.00 level could see the LTC/USD pair rejected towards the bottom of the falling wedge, around the $38.00 level.
Litecoin short-term price trend
Litecoin technical analysis shows that the cryptocurrency only has a bullish short-term bias while the price trades above the $45.00 level.
The four-hour time frame shows that a valid bearish head and shoulders pattern is still present.

According to the size of the bullish pattern, the LTC/USD pair could fall towards the $27.00 level in the short term.
Traders should note that the neckline of the pattern is located around the $38.00 support level.
A move above the $51.00 level would invalidate the bearish pattern. This may cause the LTC/USD pair to rally towards the $62.00 level.
Litecoin technical summary
Litecoin technical analysis shows that price is trapped within a large falling wedge pattern. Watch out for a strong directional move once a break from the $38.00 to $54.00 levels takes place.
