
Ethereum (ETH-USD has built on its correlation with the BTCUSD trading pair to rise from the 13 March low of $90 to the present highs of $237.80. A lot of this recovery has been driven by gradual movement of institutional money into cryptocurrencies in its search for asset vehicles that were still yielding returns when stock and commodity markets collapsed in Feb/March 2020. Will the recovery on the ETHUSD continue or has the pair reached exhaustion point? This analysis of the ETHUSD provides some insight.
Fundamental Analysis
The buzz surrounding the launch of Ethereum 2.0 has created a frenzy that has enabled this crypto retake its place as the No. 1 blockchain network for dApps. Hashrates for miners has grown 30% according to a Cryptopotato report. The COVID-19-induced market selloff that hit the stock and commodity markets seems to have awoken the institutional firms from their deep-seated slumber regarding the potential of networks like Ethereum.
As an example, Deloitte’s 2020 blockchain research report came to the conclusion that Ethereum represents blockchain’s best opportunity for enterprise use cases. Also listed and compared was enterprise blockchain solution Vechain (VET-USD), as well as Ripple (XRP-USD) and Corda. The report looks into Ethereum’s scalability and security—spaces the Ethereum team has invested in heavily even as coin prices have dropped.
As a result, Ethereum is seeing significant institutional interest. Asset management firm Grayscale now holds $338 million worth of Ethereum, most of it amassed since the beginning of the year. The systematic purchase of Ethereum by this company may have created a demand flow that drove Ethereum prices from the February lows to current levels.
Technical Analysis
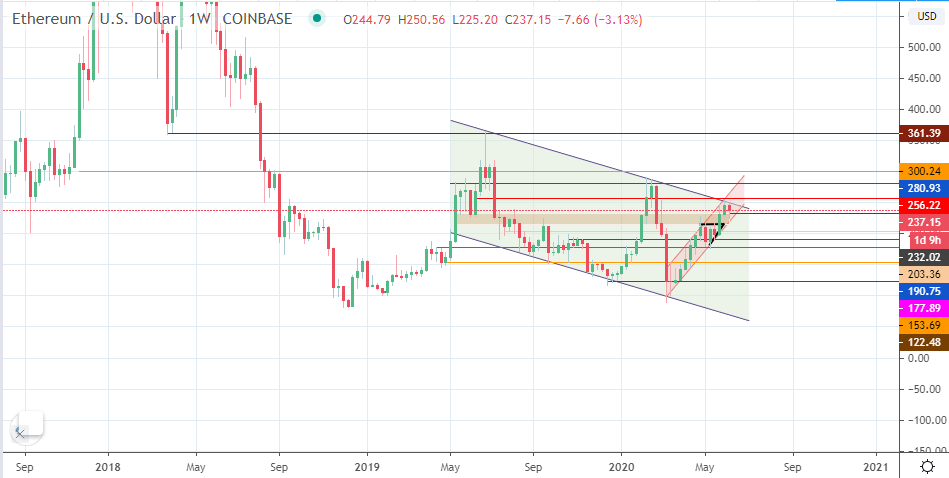
The technical analysis for ETHUSD starts on the weekly chart. The descending channel is the most conspicuous pattern on the chart and it encompasses price action from May 2019 till date. Recent price action has tested the upper border of this channel but has failed to break above it. We also see a smaller ascending channel, which contains the retracement price action to the upside, within the larger downtrend formed by the descending channel. This smaller channel has guided price from April 2020 till date, taking it to the bigger channel’s upper border where price rejection occurred. This rejection manifests within the smaller channel as the latest weekly candle, which is bearish (red color).
ETHUSD Weekly Chart: June 13, 2020
Stepping down to the daily chart, the latest price picture becomes clearer. The price action for early June 2020 was to the upside, as price on ETHUSD broke above the ascending triangle continuation pattern to allow for a move up and test of the descending channel’s upper border. Various tests of that border occurred, with all being unsuccessful at initiating a breakout. Price thereafter retreated to the downside to retest the brown price zone formed 232.02 as the price ceiling, and 214.94 as the price floor. This price floor merges with the upper border of the ascending triangle from which price broke out.
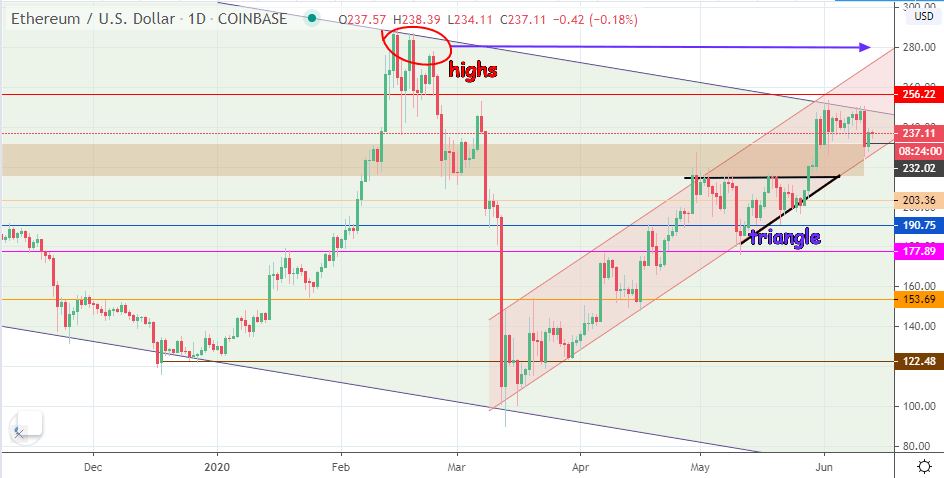
ETHUSD Daily Chart: June 13, 2020
Following the rejection at the upper border of the larger descending channel, the price candle retreated below the 232.02 support line and bounced off the lower border of the smaller ascending channel, resulting in the next daily candle starting to turn north again.
Outlook for ETHUSD
The price bounce is likely to enable ETHUSD push up once more to attempt another break of the descending channel. This move also correlates with a similar picture on the BTCUSD chart, where the pair is attempting to break the $10,000 barrier and stay above it. Similarly, ETHUSD’s attempt to push above the larger channel’s return line coincides with an attempt to breach the $250 mark and, hopefully, stay above it. If the ETHUSD pair is able to achieve a break of 250, then we can expect a move that targets the 256.22 resistance, which is where the neckline of the encircled triple top pattern (14, 19 and 24 February 2020) is found. Above this price level, 280.93 (18 May and 31 May 2019 highs) is the next upside target.
On the flip side, inability to break the return line of the descending channel could lead to another rejection. Supporting this view is the fact that recent candle highs at the larger channel’s upper border is showing signs of leveling off, which could indicate short-term exhaustion on the pair. A decline from here may allow for a retest of 232.02, 214.94 and possibly 203.36. A run to 203.36 is only possible if the support zone is breached. This move also invalidates the retracement channel which goes against the larger channel. 190.75 and 177.89 remain relevant if ETHUSD stages a major decline.
Sentiment:
- Long term: neutral
- Medium term: neutral
- Short term: bullish
Long term, the outlook is neutral. Price is no more forming higher highs/lower highs or lower highs/lower lows. Rather, the monthly chart shows price locked in a broad range which extends from 122.48 to 300.24. Only a break of the higher price changes the outlook to a bullish one, which would be a welcome break from the downtrend of 2018 and 2019. The medium-term sentiment is also neutral.
In the short term, the countertrend channel has been guiding prices to make higher highs and lower lows, taking price from the lower end of the descending channel to the upper border of this channel. This is why short-term sentiment on the ETHUSD Is bullish. However, caution must be advised as recent highs have begun to taper off, which could be a sign of pending reversal.
Did you know that Bitcoin is up +83% since 1/1/20? As world markets plummet due to COVID, investors are turning to crypto now more than ever.
We provide news, research, technical analysis and more at the Coin Agora on all things crypto!
Sign up now and get instant access to our Pick Portfolio—where three of our picks are up more than 180% in the last 12 months.
Disclosure: I am/we are long ETH-USD. I wrote this article myself, and it expresses my own opinions. I am not receiving compensation for it (other than from Seeking Alpha). I have no business relationship with any company whose stock is mentioned in this article.