Disclaimer: The following price prediction should materialize in the next 24-48 hours.
As the collective market underwent a bearish pullback, Ethereum’s price dropped below its support at $233 for the first time since 18th June. Although the coin attempted to sustain a position above $233, the selling pressure brought down the asset under the range.
At press time, Ethereum was valued at $229 with a market cap of $25.69 billion in the charts.
Ethereum 30-min chart
Source: ETH/USD on Trading View
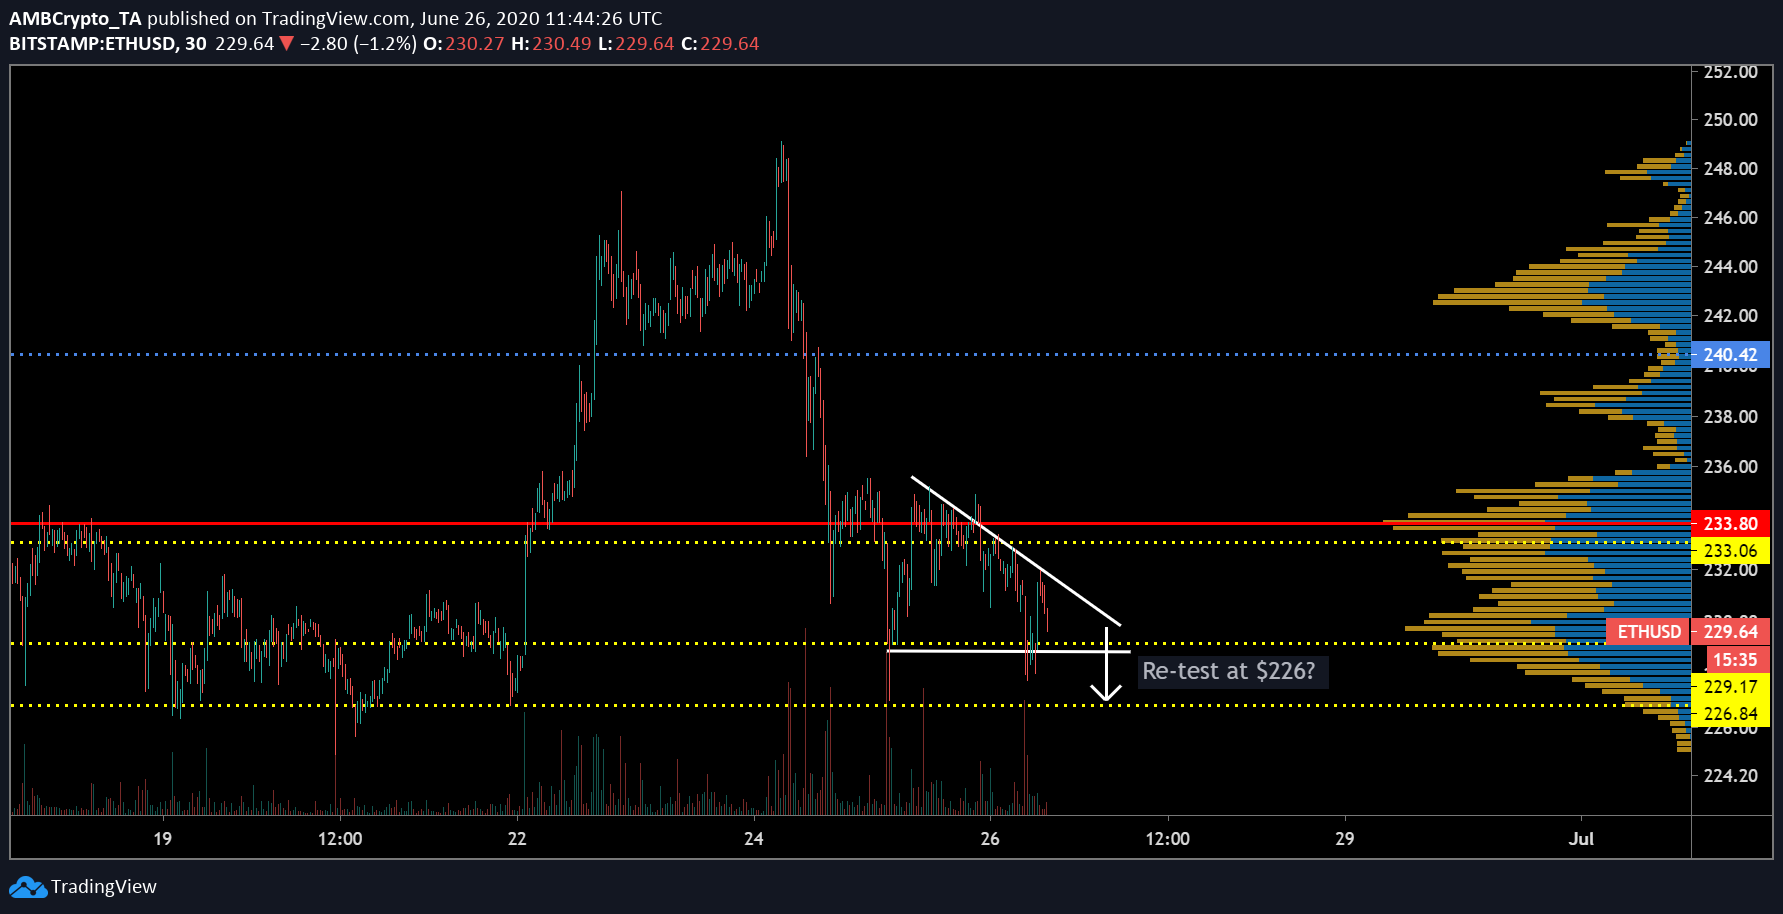
As pictured in the above chart, Ethereum’s movement since 22nd June has been extremely turbulent as the price briefly breached above $240 resistance. However, 24-hours back, the asset declined below its support at $233 and maintained movement between the range of $233 and $229. The near-term does not look positive either as the current price movement exhibited the formation of a descending triangle.
Possibility of a bearish breakout remains high in the chart which may witness Ethereum re-testing resistance at $226. Although VPVR suggested strong support at $229, a move down to $226 in the next 24-hours is fairly likely.

Source: ETH/USD on Trading View
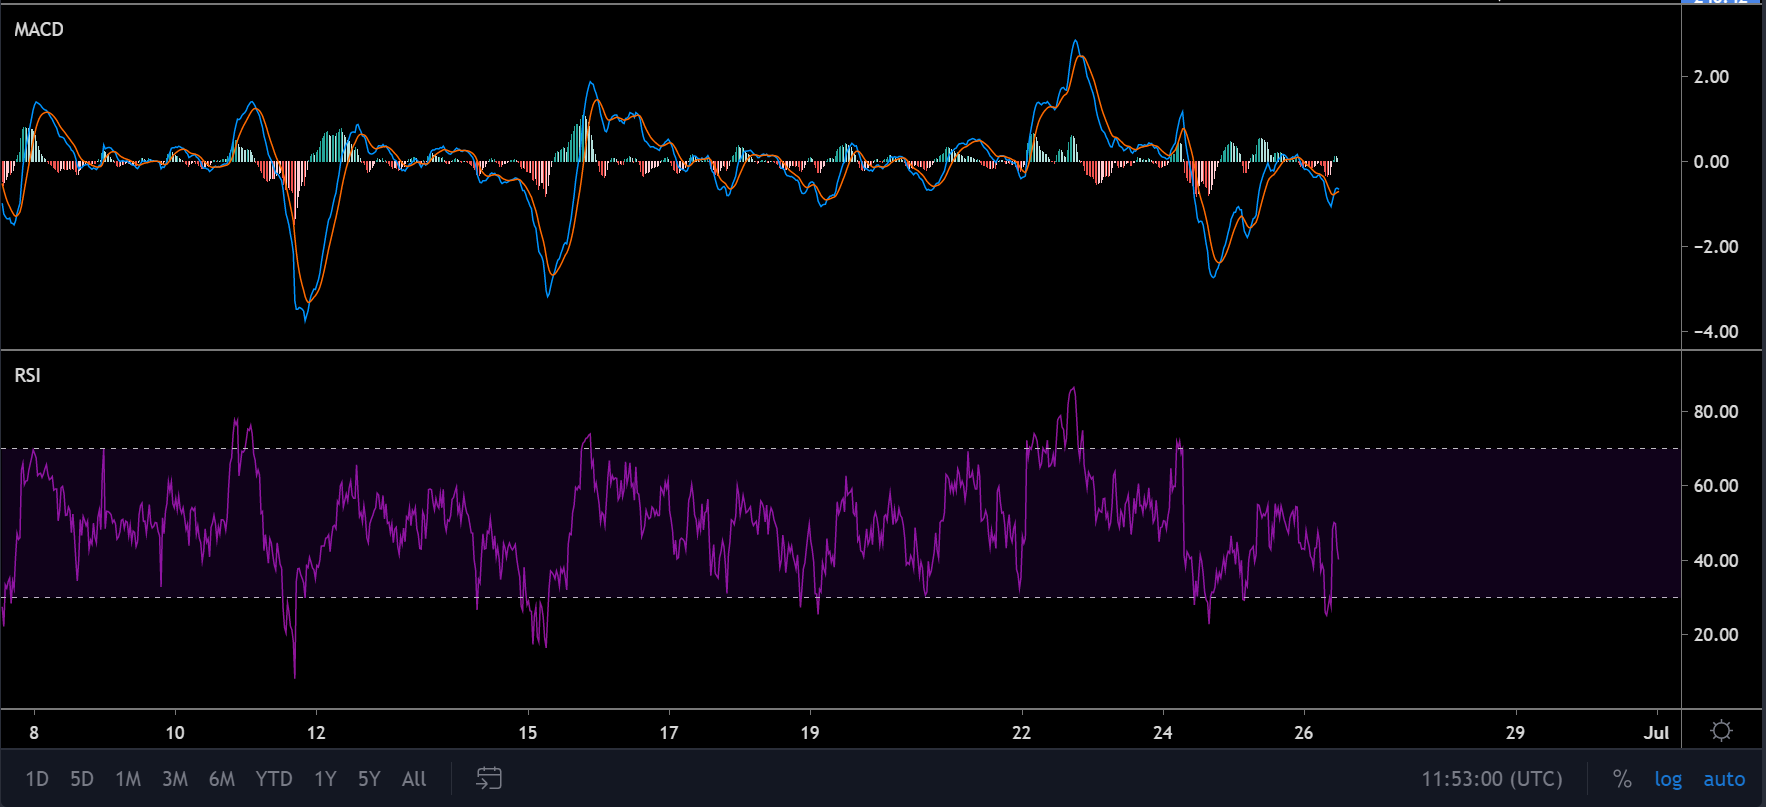
MACD suggested a bullish trend for the asset at the time of writing but the Relative Strength Index or RSI suggested that the selling pressure was establishing an upper-hand in the charts.

Source: ETH/USD on Trading View
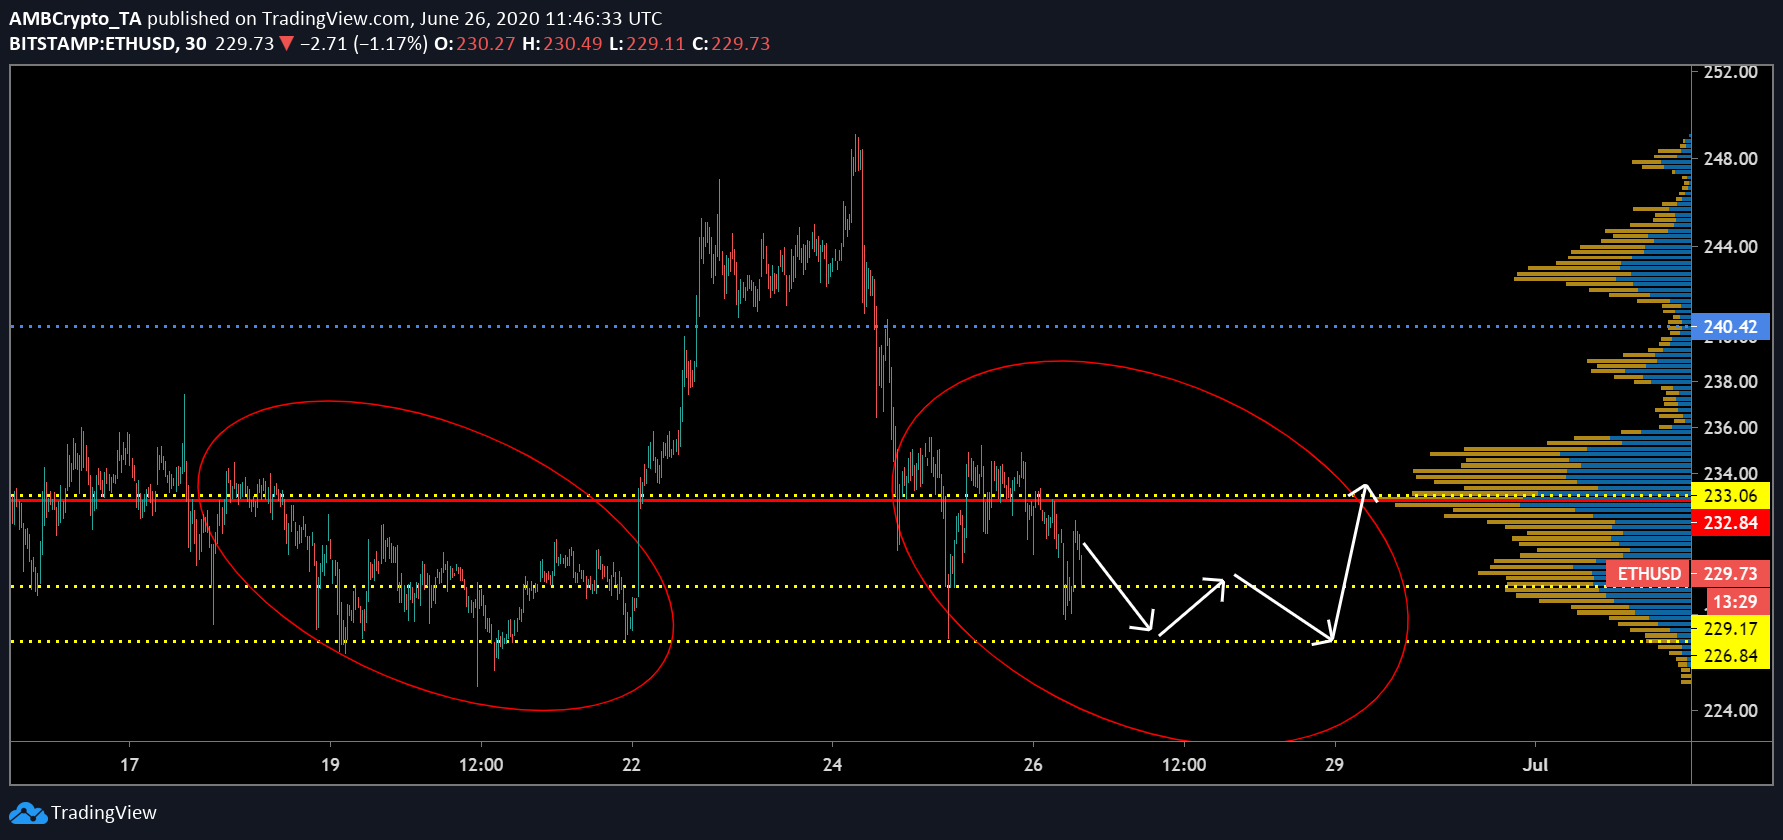
A sense of optimism can be expected by Ethereum supporters if the asset mirrors its recent movement in the charts. As illustrated in the above chart, ETH had reciprocated a similar drop below $233 on 18th June, before breaking above the resistance on 22nd June.
The odd chances of a similar pattern being followed over the next few days would see Ethereum breach above $233 once again by the 29th of June.
Conclusion
Ethereum may re-test support at $226 over the next 24-48 hours and a possible re-test of resistance $233 might take place by the 29th of June.

Your feedback is important to us!
