Ethereum‘s price movement since the start of June has triggered various alterations in the market. On-chain metrics were evidently indicating various trends but some of them had peculiar differences.
Source: Skew
Glassnode’s recent chart brought everyone’s attention to the recent increase in Ethereum price as a percentage of Bitcoin’s price. At the moment, Ethereum value was 2.5 percent of Bitcoin‘s price which is strong revival from 2.1 percent from May 15th.
However, the above positive uptick has occurred in a span of 48 hours as only on 2nd June, Ethereum’s valuation was on a decline. Many may suggest such price variation would indicate a rise in volatility but the particular difference was evident only in the aforementioned metric.

Source: Skew
As observed in the chart above, in spite of the recent hike, Ethereum is exhibiting a 6-month low Implied Volatility at 3.8 percent in the chart. The decrease in Implied Volatility has been a consistent trend since the collapse in May and the recent price surge up to $253, did not proliferate a trend reversal.
However, with respect to Bitcoin, it was under a different story altogether.

Source: Skew
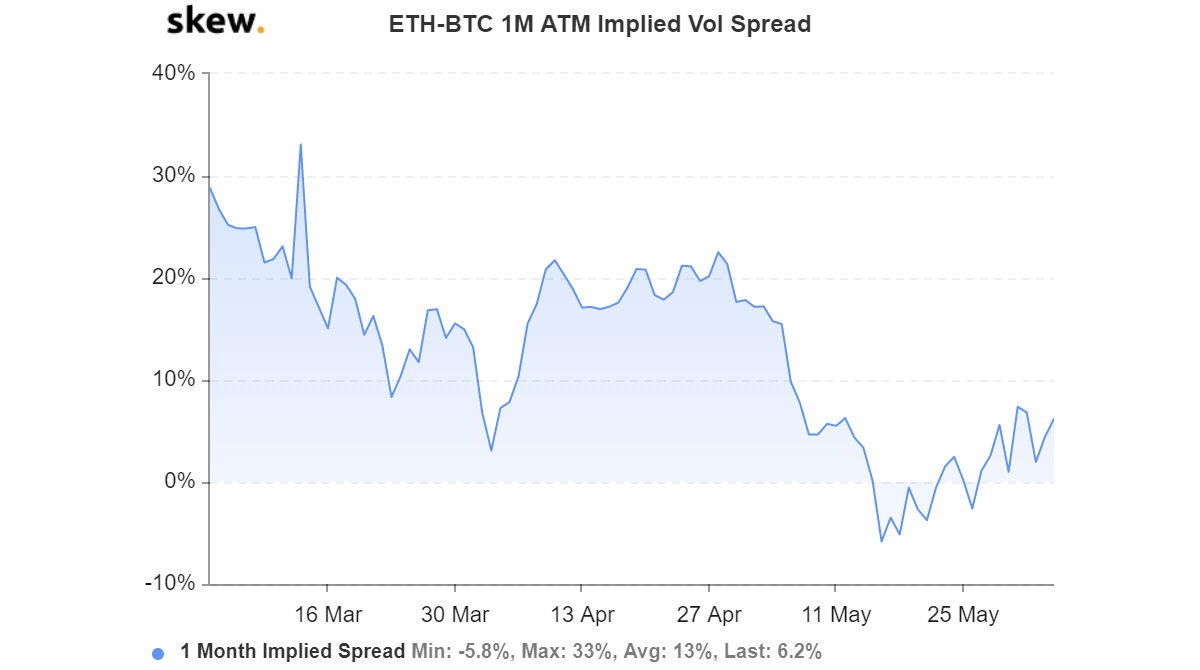
According to the above chart, Ethereum-Bitcoin 1-month Implied Volatility Spread is currently on the rise which suggested that Bitcoin hasn’t been able to keep up the same pace as Ethereum’s valuation has in the market. Since the 2nd week of May, Ether has registered significant improvement in terms of on-chain fundamentals and the interest in ETH futures and options has also assisted its case.
Ethereum’s correlation with Bitcoin has also dropped down to 0.8497 at press time, which is significantly down from last month’s 0.89 index.
In the current market, it would not be inaccurate to state that Ethereum has been the major needle mover in the industry since the conclusion of Bitcoin halving but the apparent turbulence might tip in favor of Bitcoin in the near-term as the largest digital asset continues to struggle to sustain a position over $10,000.
Your feedback is important to us!
