In brief:
- ChainLink (LINK) seems unfazed by Bitcoin’s drop in the crypt markets.
- LINK experienced its All-time-high value on May 4th, 2020, and looks set to retest this level.
- Hodlers of LINK continue to increase and have doubled in 2020.
Crypto traders and investors scrolling down Coinmarketcap.com will notice that majority of the digital assets are experiencing significant losses save for ChainLink (LINK) which is up 3.41% in the last 24 hours.
This is besides the fact that Bitcoin experienced another massive dip to $9,009 earlier today and rebounded back above $9,200. With BTC inching closer to a bear market, LINK has totally decoupled from the effects of Bitcoin in the crypto markets. This fact has been summarized by the following tweet by @MatiGreenspan.
All markets: AAAAAAAHHHHHHHHHHHHHHH!
Link: What bear market? pic.twitter.com/sdh1HzFsOB
— Mati Greenspan (tweets are not trading advice) (@MatiGreenspan) June 25, 2020
ChainLink (LINK) Hodlers Increase by 100% in 2020
On the 4th of May this year, LINK experienced its all-time-high value of $4.95 thanks to an increment of holders and traders of the token. As earlier mentioned, LINK is in the green and trading at $4.79 and looks set to attempt to break this all-time-high value of $4.95.
The popularity of LINK has thus led to more investors buying and holding the asset. The team at Glassnode has done an analysis of LINK addresses and come to the conclusion that the number of LINK holders has increased by 100% since the beginning of 2020. Furthermore, an impressive 160,000 addresses hold LINK at the time of writing this. A summary of the analysis can be found in the following tweet by Glassnode.
The number of $LINK token holders continues to see a steady increase in 2020.
There are currently more than 160,000 addresses holding LINK – an increase of 100% since the beginning of the year.
Live chart: https://t.co/qmTvHDXF3t pic.twitter.com/BPp65NaNU2
— glassnode (@glassnode) June 25, 2020
What Next for LINK in the Crypto Markets?
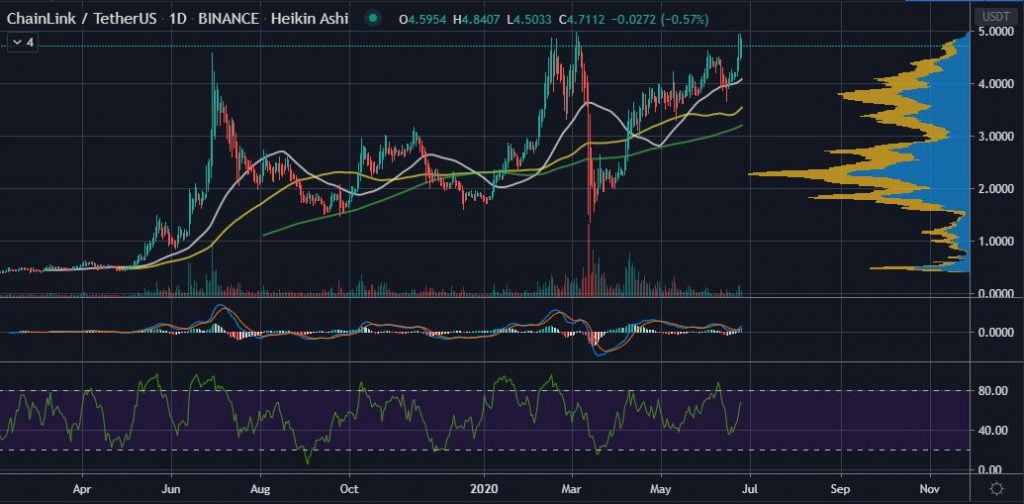
Further checking the daily LINK/USDT chart courtesy of Tradingview, the following is observed.
- LINK is clearly in bullish territory with its value above the 50-day, 100-day and 200-day moving averages.
- Trade volume is in the green with the MACD also indicating some bullishness.
- The daily MFI is yet to show serious signs of exhaustion at a value of 67.
- LINK has a short term resistance at $4.85 and the earlier mentioned all-time-high value of $4.95.
- In terms of short term support zones, LINK has $4.55, $4.37, $4.21, $4.05 and $3.96
In conclusion, LINK seems to be in clear bullish territory and could be gearing up for another attempt at its all-time-high value of $4.95. However, traders and investors are advised to have an eye out for any sudden movements by Bitcoin that could ruin the momentum for LINK. Additionally, risk management is further advised such as the use of stop losses when trading LINK.
Disclaimer: This article is not meant to give financial advice. Any additional opinion herein is purely the author’s and does not represent the opinion of EWN or any of its other writers. Please carry out your own research before investing in any of the numerous cryptocurrencies available. Thank you.

