The chart below directly illustrates why trading Bitcoin can be dangerous at times.
The top chart shows BTC/USD prices on the Bitfinex exchange, while the bottom shows the same pair trading on Coinbase.
On the chart above there was a clear mini-crash lower with decent volume behind it. The difference can be measured in percentage on the right-hand side.
Amazingly, 7201.30 was the candle low on Bitfinex while on Coinbase the low stands at 7244.56.
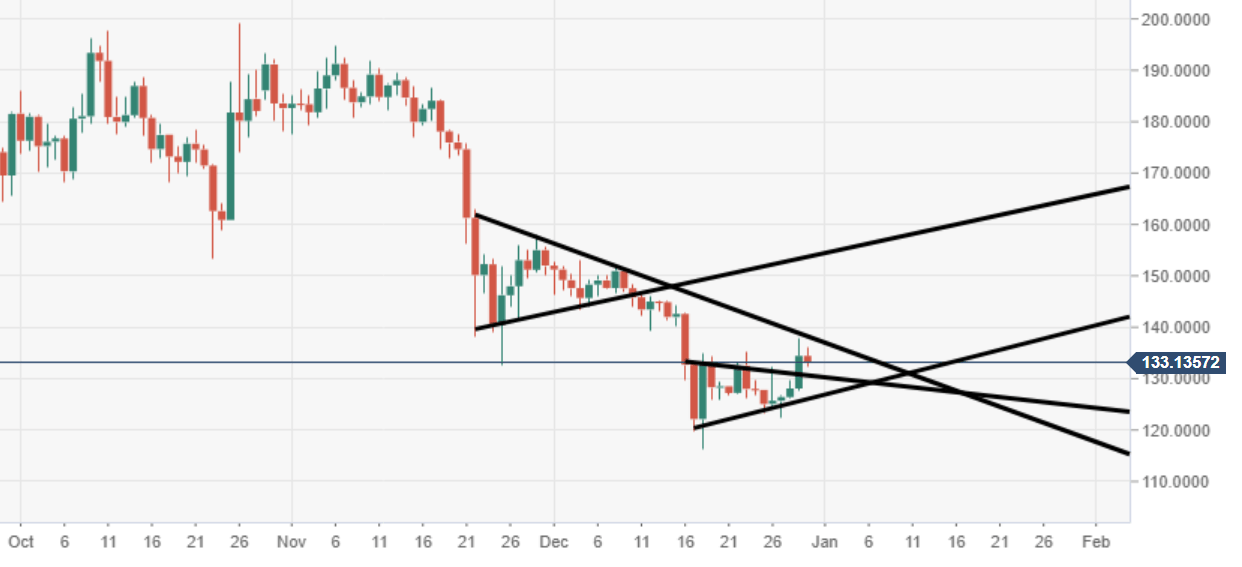
Ethereum Technical Analysis: ETH/USD must break $140 for any hope of a recovery
Ethereum price is trading in the red by some 0.35% in the session on Friday.
ETH/USD price action is running at four consecutive days in the green, as the bulls look to regain control.
A big barrier of resistance can be observed at the $140 price mark.
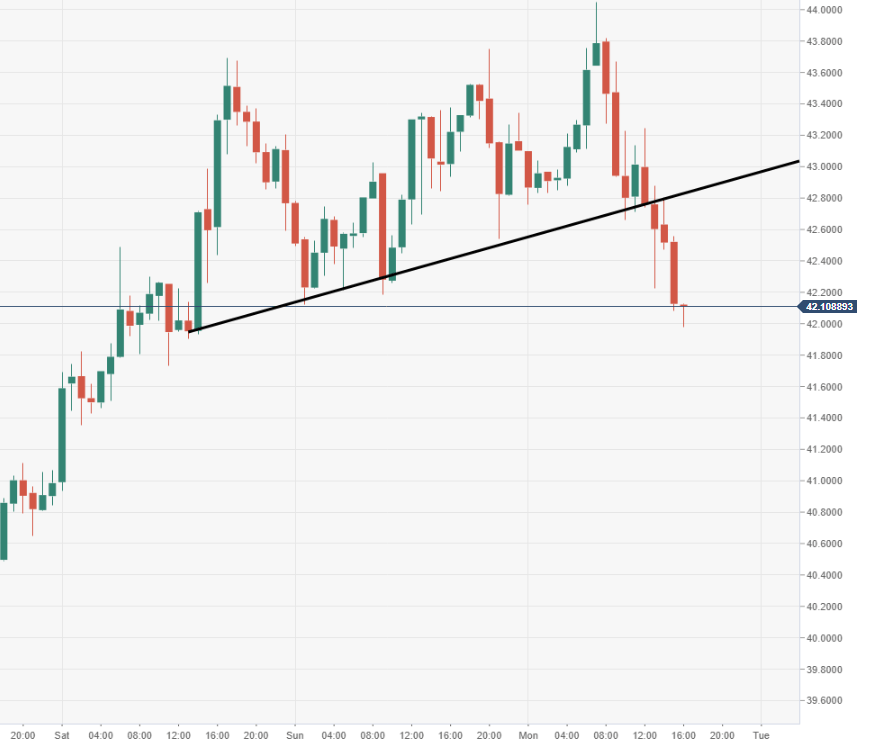
Litecoin Technical Analysis: LTC/USD bulls have the opportunity to push for a recovery
Litecoin price is trading in minor negative territory by some 0.50% in the session on Monday.
LTC/USD is running with three consecutive sessions in the green, as the bulls push for a recovery.
The next major area of interest will likely be towards the psychological $50 mark.
Image Sourced from Pixabay


