- XRP climbed by 3.5% today as it managed to reclaim the $0.2 level.
- The cryptocurrency is trading at the 100-days EMA resistance and remains within the descending triangle.
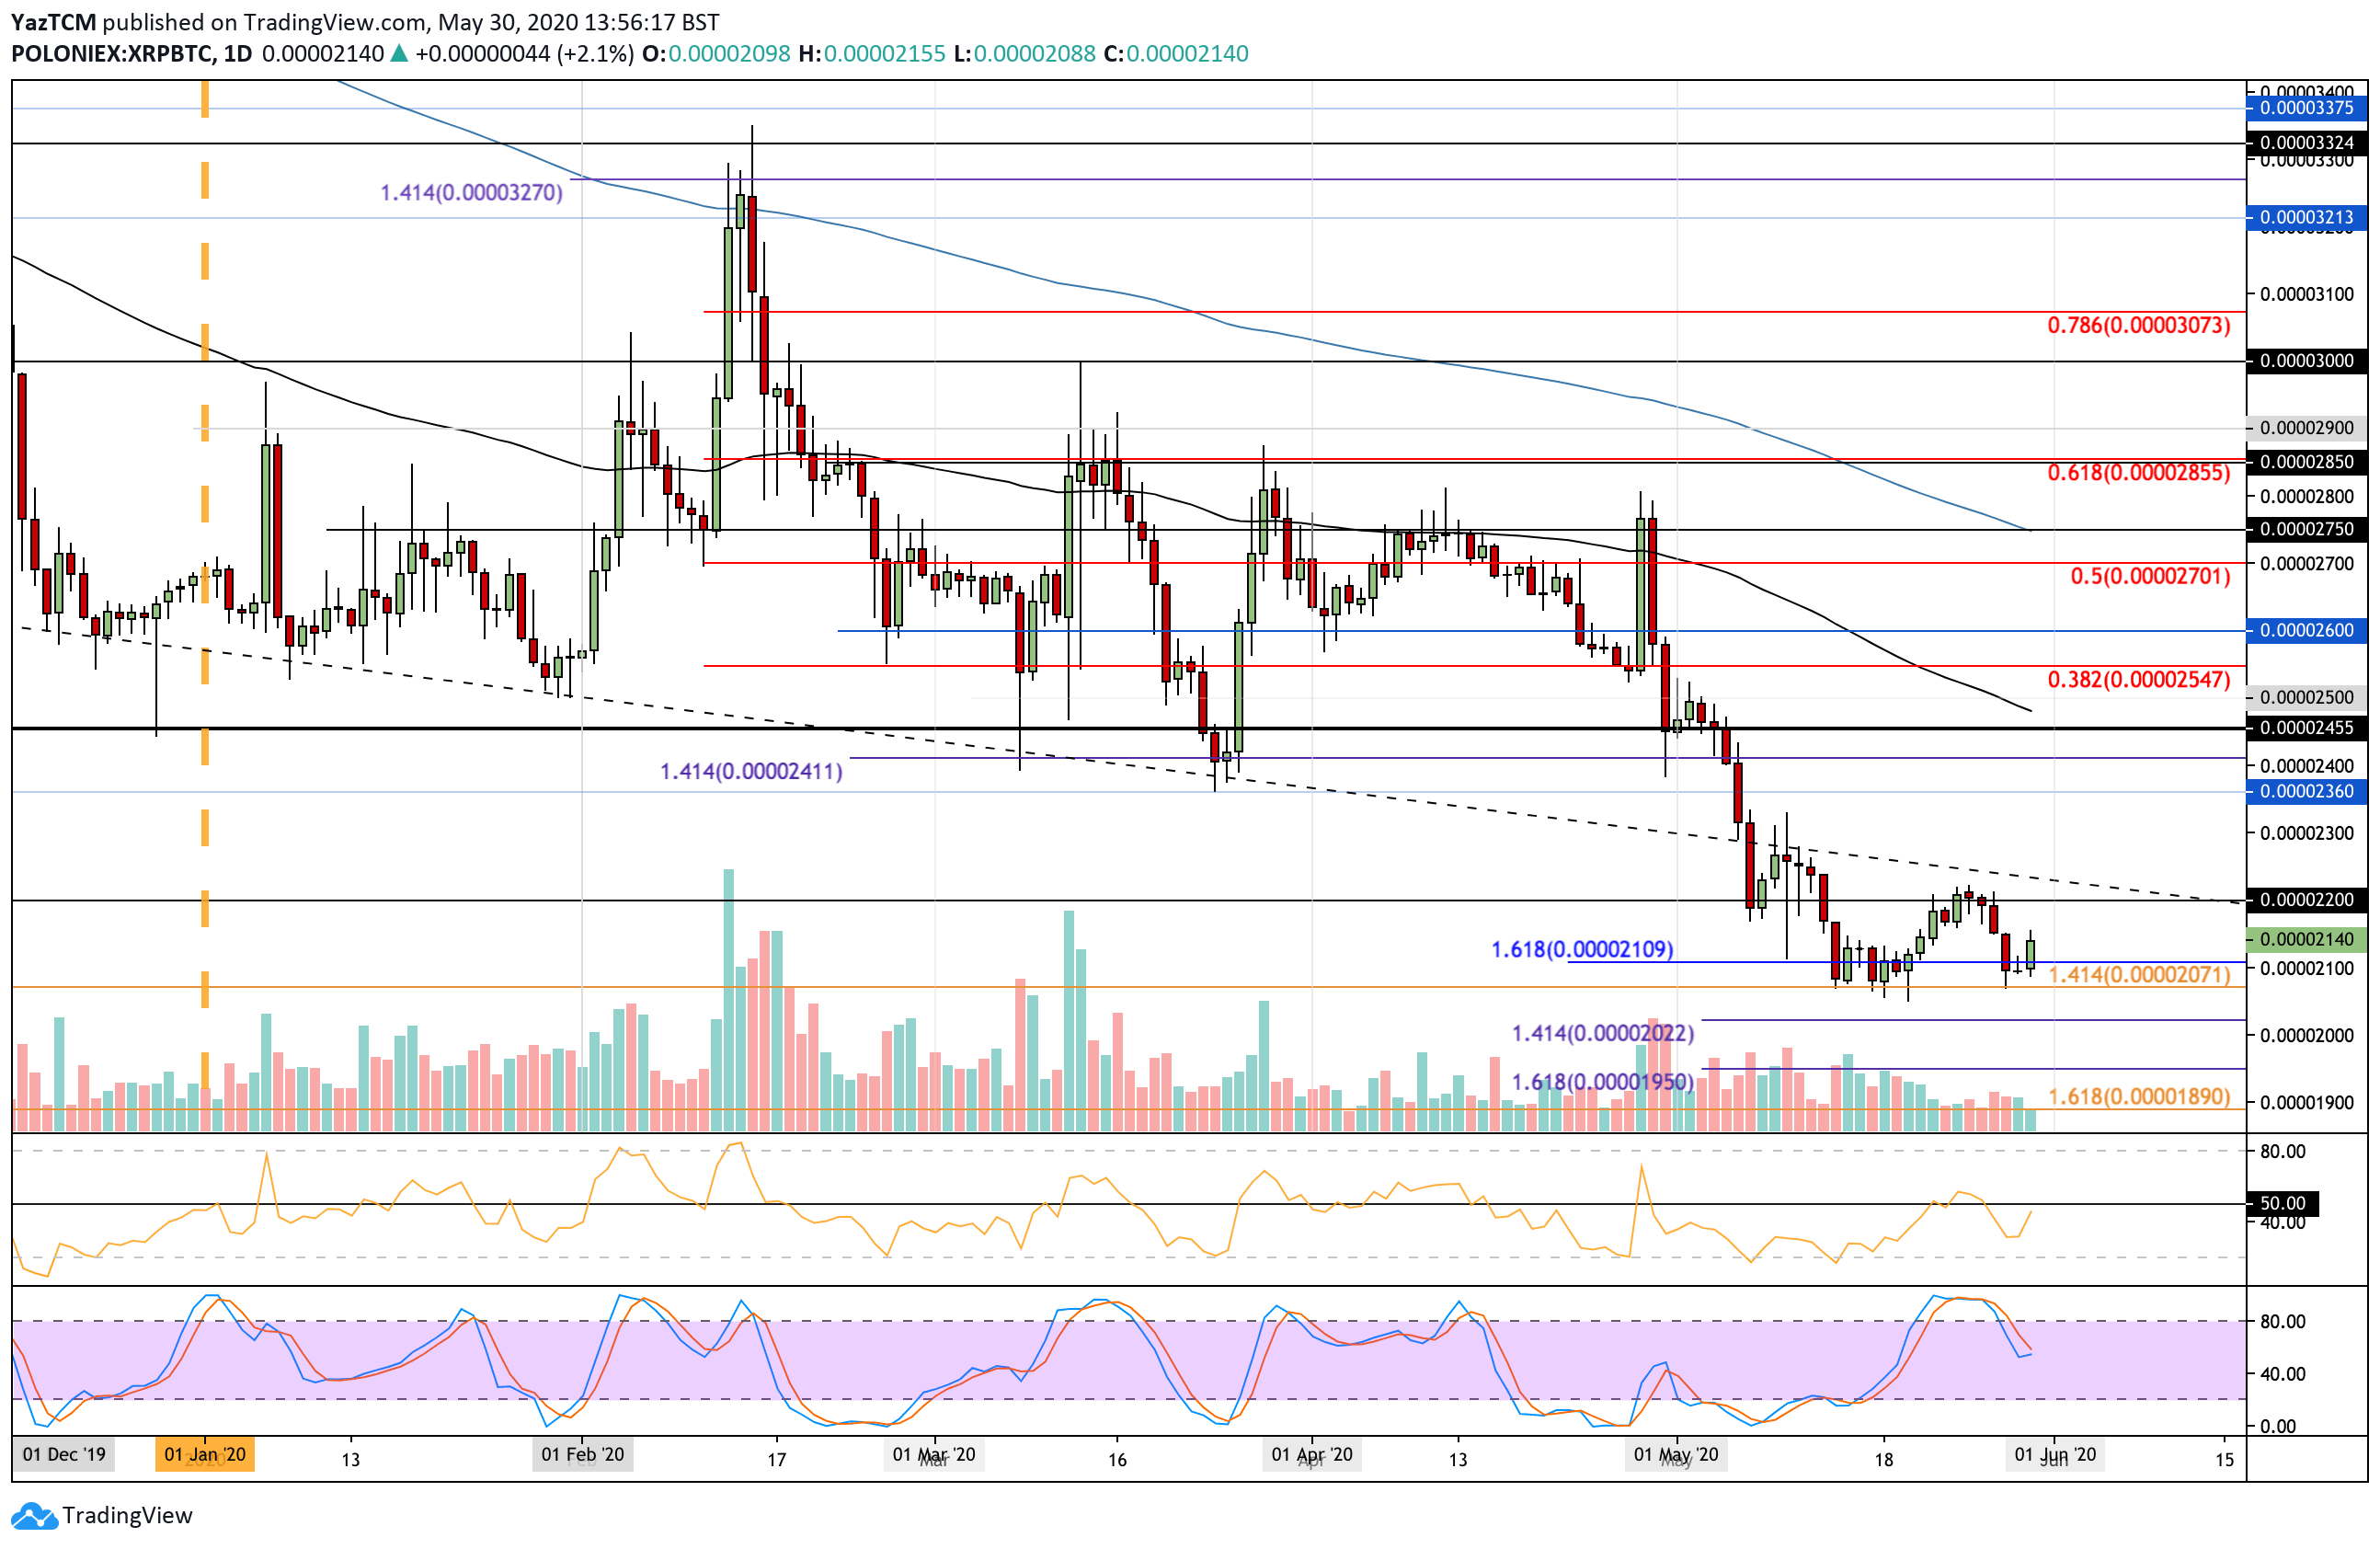
- Against Bitcoin, XRP is trading near 2-year-lows, but the buyers are attempting to push higher.
Key Support & Resistance Levels
XRP/USD:
Support: $0.2, $0.192, $0.18.
Resistance:$0.215, $0.225, $0.235.
XRP/BTC:
Support: 2100 SAT, 2070 SAT, 2050 SAT.
Resistance: 2200 SAT, 2250 SAT, 2300 SAT.
XRP/USD – XRP Approaching Triangle Apex
XRP climbed by 3% over the past 24 hours as it breaks back above the $0.2 level and reaches the 100-day EMA. It also reached the upper boundary of an acute descending triangle that it has been trading within for the entire month of May.
If the bullish momentum can continue to drive XRP above this triangle, then it possibly could continue higher to break the resistance at the 200-days EMA and head back toward the 2020 highs.
XRP-USD Short Term Price Prediction
Once the buyers break the upper boundary of the triangle, the first level of resistance is located at $0.215. Above this, resistance lies at the 200-days EMA, $0.225 (bearish .5 Fib Retracement), and $0.235.
On the other side, if the sellers push lower, the first level of support lies at $0.2. Beneath this, support is found at $0.192 (.382 Fib Retracement), $0.18, and $0.175 (.5 Fib Retracement).
The RSI has poked itself above the 50 line, which indicates that the bulls have started to take charge of the bullish momentum. If it can continue to rise, XRP should easily be able to break to the upside of the current triangle.
XRP/BTC – XRP Rebounds From Multi-Year Lows
Against Bitcoin, XRP reached the multi-year low at 2071 SAT this week and managed to rebound higher from there. It pushed back above 2100 SAT to reach the current 2140 SAT level.
XRP has a very long way to recover back to the 2020 highs against Bitcoin and would need to climb as high as 2500 SAT to turn bullish again.

XRP-BTC Short Term Price Prediction
If the buyers can continue with this bounce higher, the first level of resistance lies at 2200 SAT. Above this, resistance is located at 2300 SAT, 2360 SAT, and 2455 SAT.
On the other side, the first level of support lies at 2100 SAT. Beneath this, support is located at 2071 SAT, 2050 SAT, and 2000 SAT.
The RSI is rising back toward 50 as the selling momentum starts to fade. It will still need to break above 50 for the buyers to take solid control of the market momentum.
Click here to start trading on BitMEX and receive 10% discount on fees for 6 months.
Disclaimer: Information found on CryptoPotato is those of writers quoted. It does not represent the opinions of CryptoPotato on whether to buy, sell, or hold any investments. You are advised to conduct your own research before making any investment decisions. Use provided information at your own risk. See Disclaimer for more information.
Cryptocurrency charts by TradingView.
