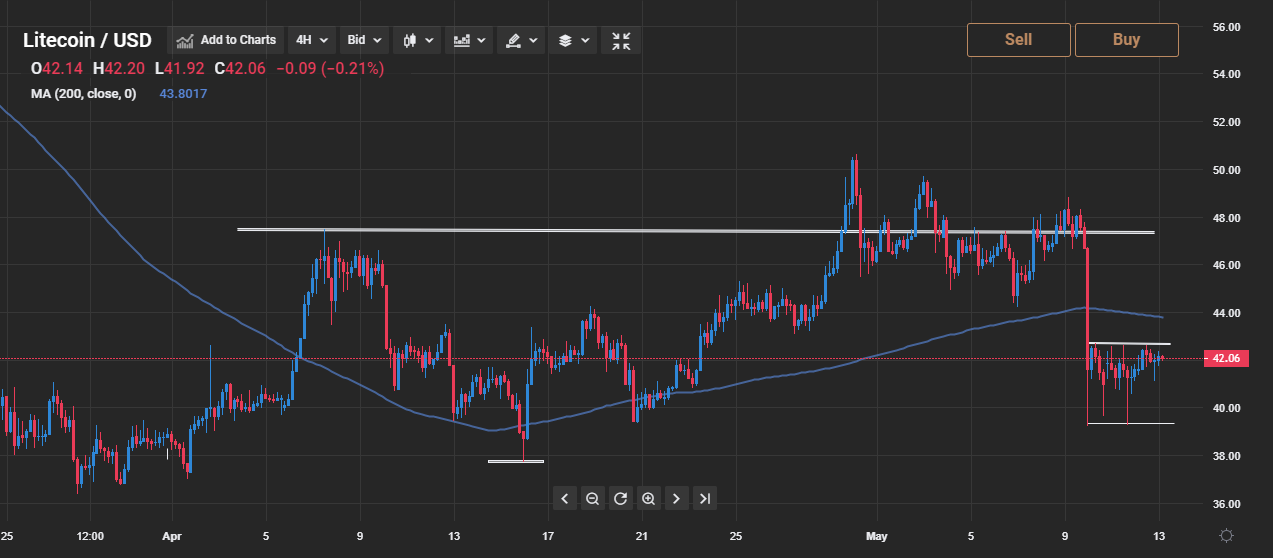
Litecoin is under pressure over the short and medium term after the LTC/USD pair plunged lower over the weekend alongside the broader cryptocurrency market.
Litecoin price analysis shows that a break under the $38.00 support level could trigger even more downside in the seventh largest cryptocurrency.
Litecoin medium-term price trend
Litecoin has reversed back towards the $40.00 support level after the cryptocurrency suffered another flash crash last weekend.
Litecoin technical analysis shows that a bearish breakout from a large triangle pattern is close to taking place on the daily time frame.
The daily time frame shows that price is starting to test towards the bottom of a large triangle pattern, around the $41.00 level.
According to the size of the triangle pattern, a breakout below the $41.00 level could cause the LTC/USD pair to fall towards the $20.00 level.
It is worth noting that the LTC/USD pair has a bearish medium-term bias while price trades below the $51.50 level.
Litecoin short-term price trend
Litecoin technical analysis shows that the cryptocurrency only has a bearish short-term bias while price trades below the $44.00 level.
The four-hour time frame shows that a head-and-shoulders pattern appears to be taking shape.

According to the size of the bearish pattern, the LTC/USD pair could fall towards the $22.00 level over the short term.
Watch out for a steep decline in the LTC/USD pair if price starts to hold below the neckline of the pattern, around the $37.00 level.
Litecoin technical summary
Litecoin technical analysis shows that a bearish reversal pattern may be forming. The higher time frames also show that a triangle pattern breakout is close to happening on the daily time frame.
