
LTC/USD Price Technical Outlook
Possible Bullish Comeback
On May 11, Litecoin printed $39.5- its lowest level in three weeks. Later on, the price rallied and settled above the 40 threshold. Yet, the weekly candlestick closed in the red with nearly 12% loss. This week, the price has continued its rally and recovered the majority of last week’s losses.
This week, the Relative Strength Index (RSI) has crossed above 50 signaling a possible start of a bullish momentum.
Litecoin PRICE DAILY CHART (MaR 15, 2019 – May 19, 2020) Zoomed Out

Recommended by Mahmoud Alkudsi
Traits of Successful Traders
Litecoin PRICE DAILY CHART (March 12 – May 19, 2020) Zoomed In
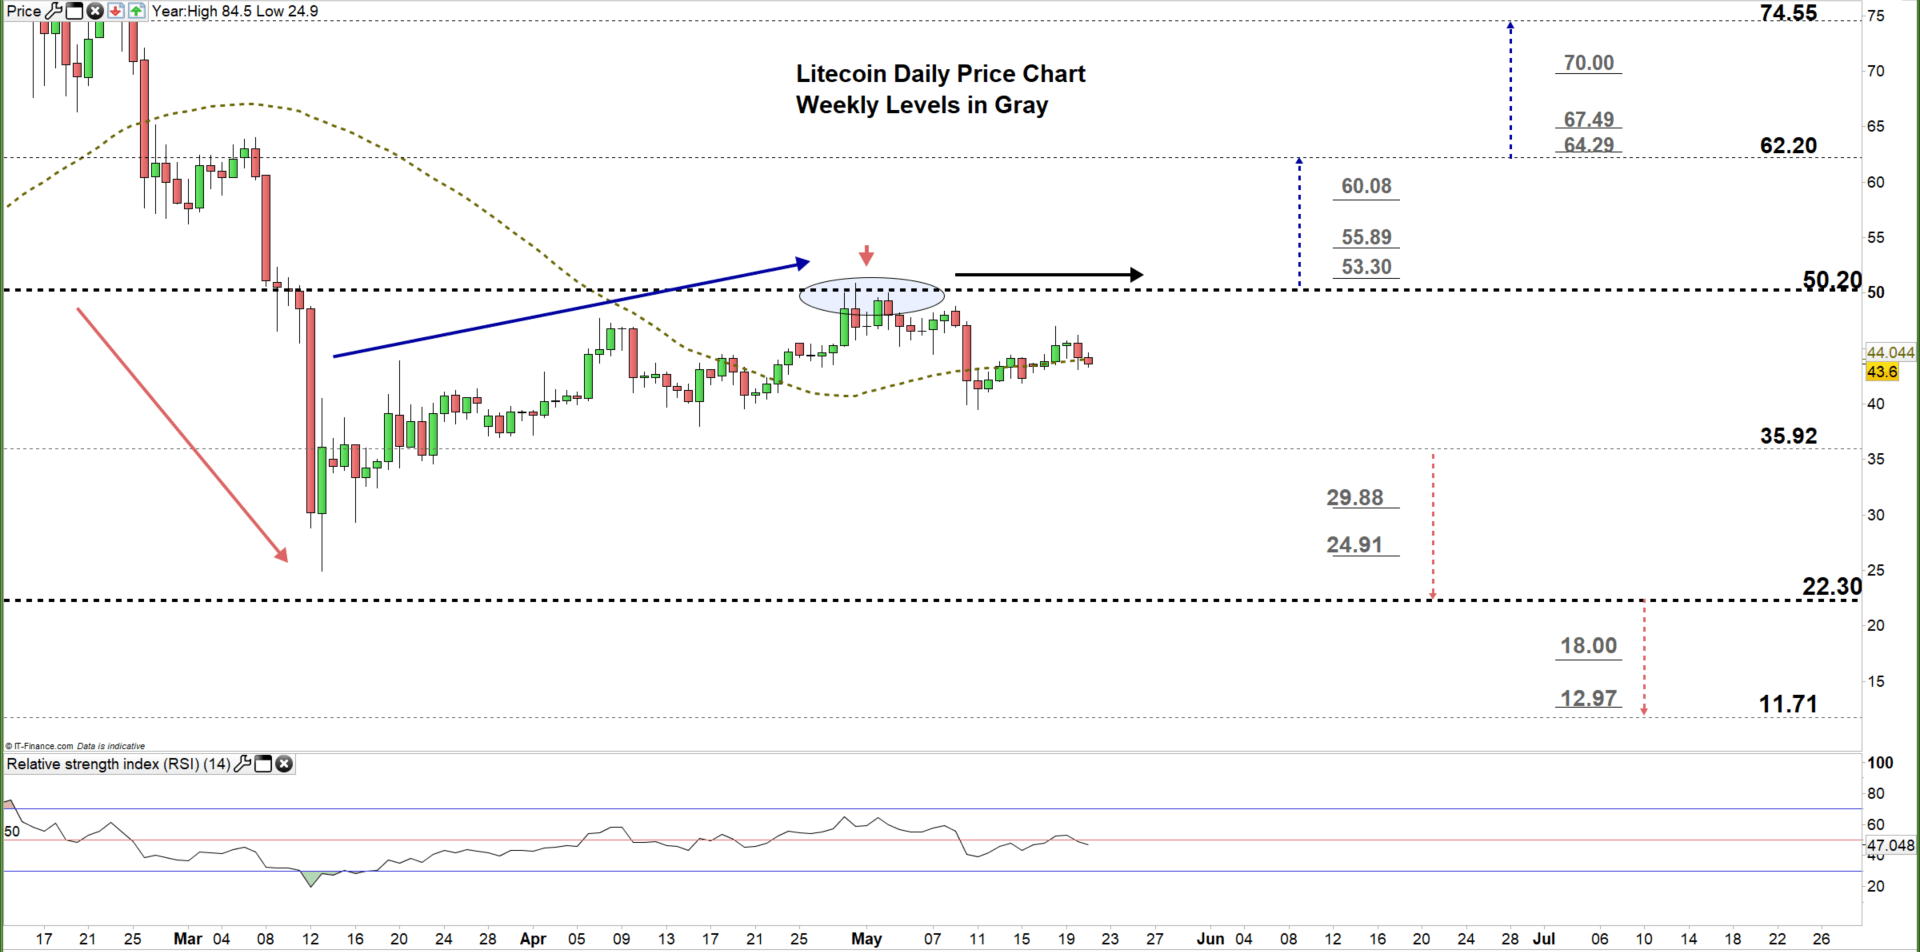
Based on the daily chart analysis, on April 6 Litecoin started a bullish momentum creating higher highs with higher lows. However, in late April the price reversed from the high end of the current trading zone $35.92- $50.20 reflecting a weaker bullish sentiment. On Saturday, the market corrected its uptrend and carved out a lower high at $48.8.
A close below the low end of the aforementioned zone may encourage bears to press LTC/USD towards $23.30.That said, the weekly support levels underscored on the chart (zoomed in) should be considered.
Any close in the other direction i.e. above the high end of the zone could resume bullish price action towards $62.20. A further close above that level may extend the rally towards $74.55. Nonetheless, the weekly resistance levels printed on the chart should be kept in focus.

Recommended by Mahmoud Alkudsi
Building Confidence in Trading
Litecoin PRICE FOUR Hour CHART (April 21 – May 19, 2020)

Looking at the four-hour chart, on April 23 the price broke above the downtrend line originated from the April 7 high at $47.7. As a result, the market rallied on April 30 to an over seven-week high at $50.9.
At present, the market eyes a test of the downtrend line originated of the May 3 high at $49.6. Any violation of this line would be considered as a bullish signal. A break above $47.28 would be considered an additional bullish signal and may trigger a rally towards the high end of the current trading zone discussed above on the daily chart. Although, the daily resistance level marked on the chart should be watched closely.
On the other hand, any break below could send LTC/USD towards the $38.00 handle. Nevertheless, the weekly support level underlined on the chart should be monitored.
See the chart to know more about the critical levels in a further bearish/ bullish move.

Recommended by Mahmoud Alkudsi
Improve your trading with IG Client Sentiment Data
Written By: Mahmoud Alkudsi,Market Analyst
Please feel free to contact me on Twitter: @Malkudsi