The upcoming launch of Ethereum 2.0 has investors and market participants alike speculating whether Ether is preparing for a moonshot. After the most recent correction that saw prices plummet to $191, many have claimed that the smart contracts giant hit market bottom.
Santiment, a behavior analytics platform, noticed that some Reddit users are becoming overwhelmingly bullish, and FOMO seems to be building up. The firm was able to collect some of the most popular comments on the social network, which include:
“Y’all got anymore of that $200 ETH? My funds just cleared and I wanted to buy right at the line.”
Bullish Comments About Ethereum Emerge in Reddit. (Source: Twitter)
With all the buzz around Ethereum, a contrarian could argue that instead of a bullish impulse, a downswing could be on the works. But is it possible?
A Correction Ahead of Ethereum
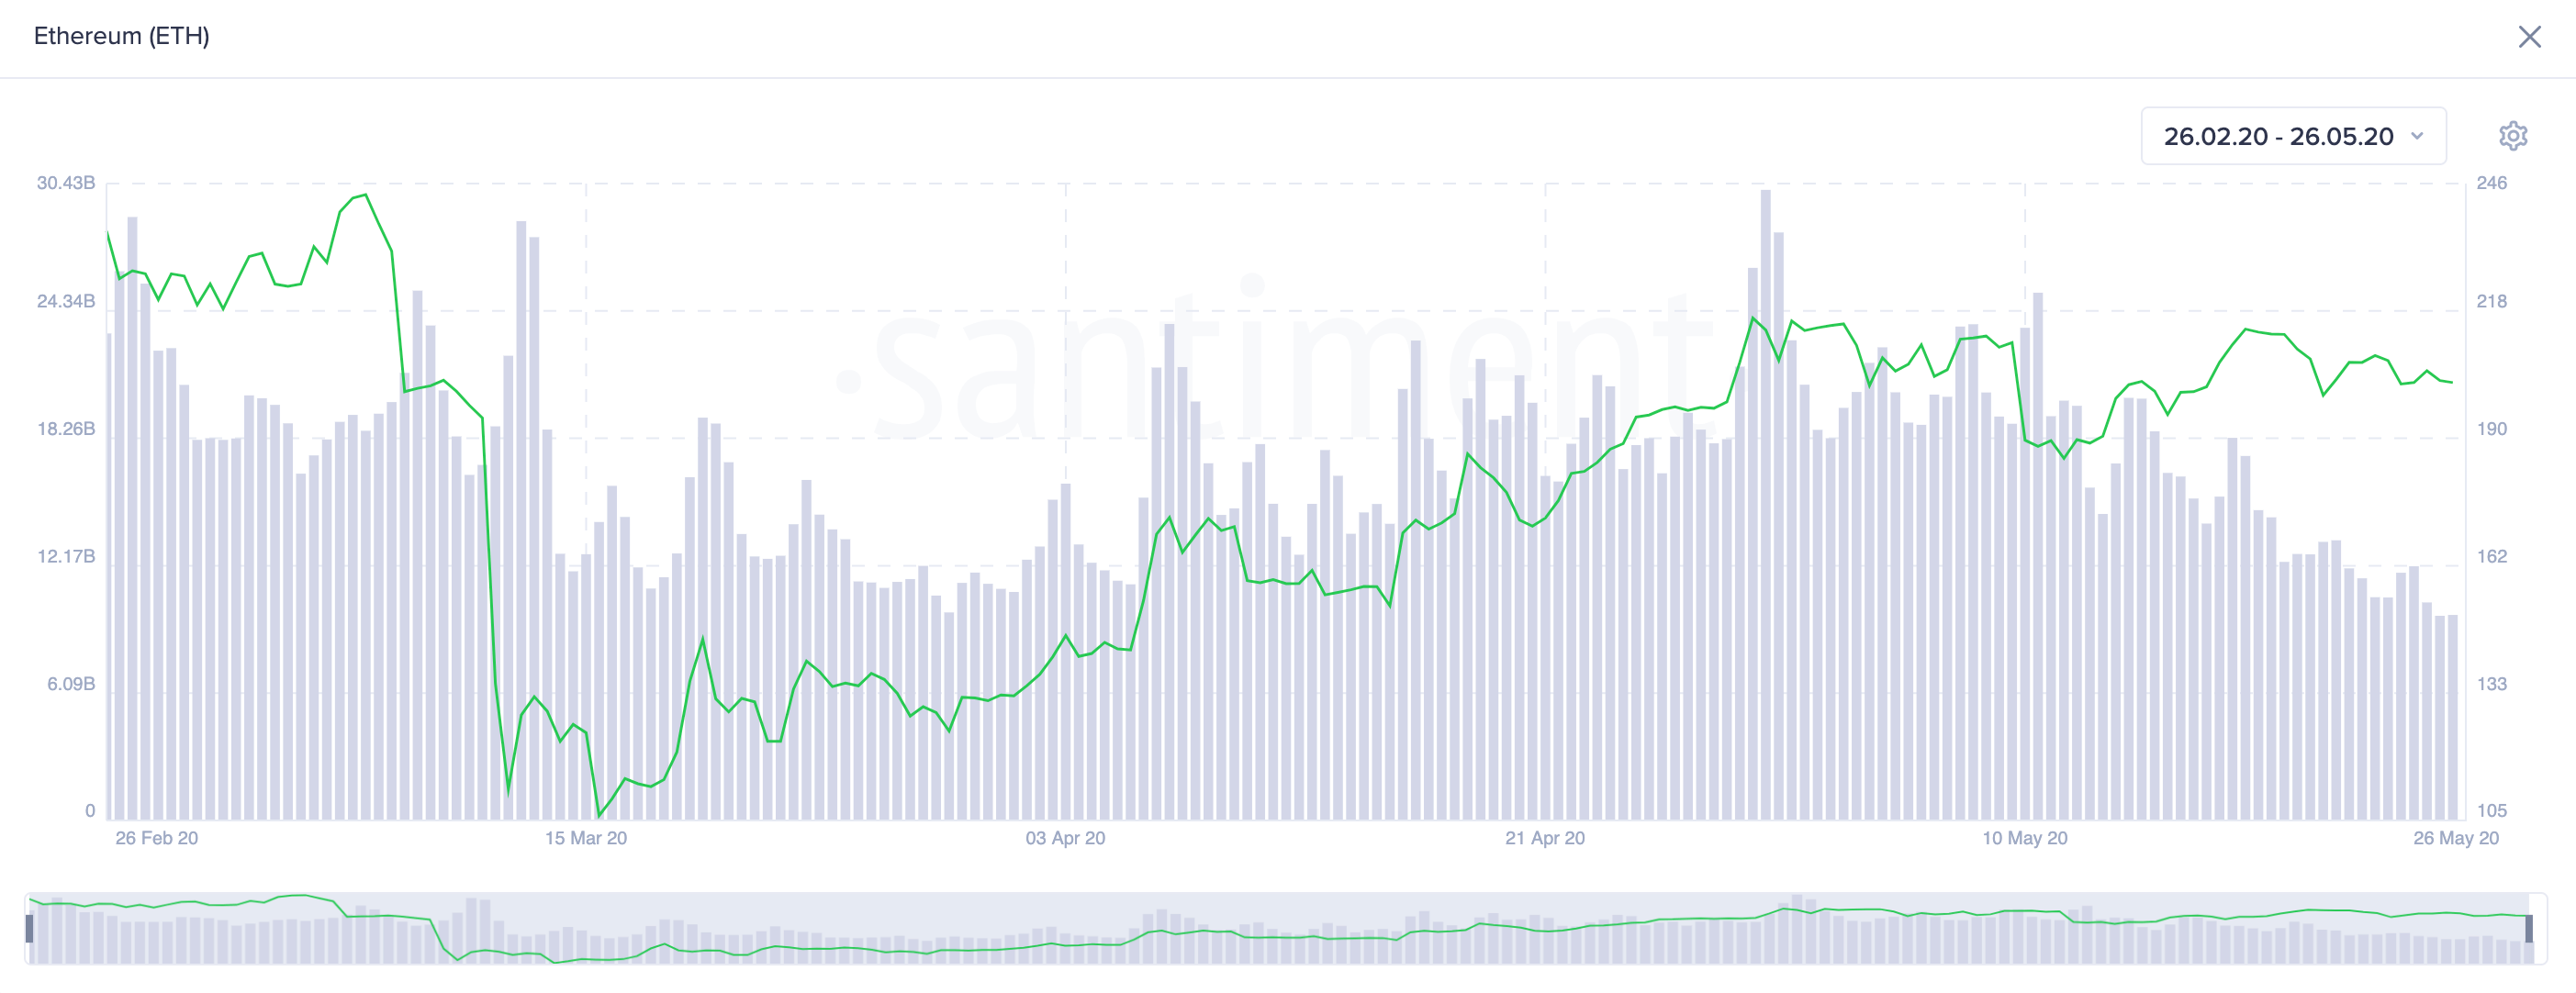
Ethereum is currently being held by a significant support level that sits around $200. However, its on-chain volume appears to have leveled off for over the past couple of weeks, based on data from Santiment.
Ever since the peak of $227 on April 30, the on-chain volume of the smart contracts giant has been steadily declining while its pricer appears to have entered a consolidation phase. This significant divergence between price and volume may suggest that Ether could be bound for a steep correction.

Ethereum On-Chain Volume. (Source: Santiment)
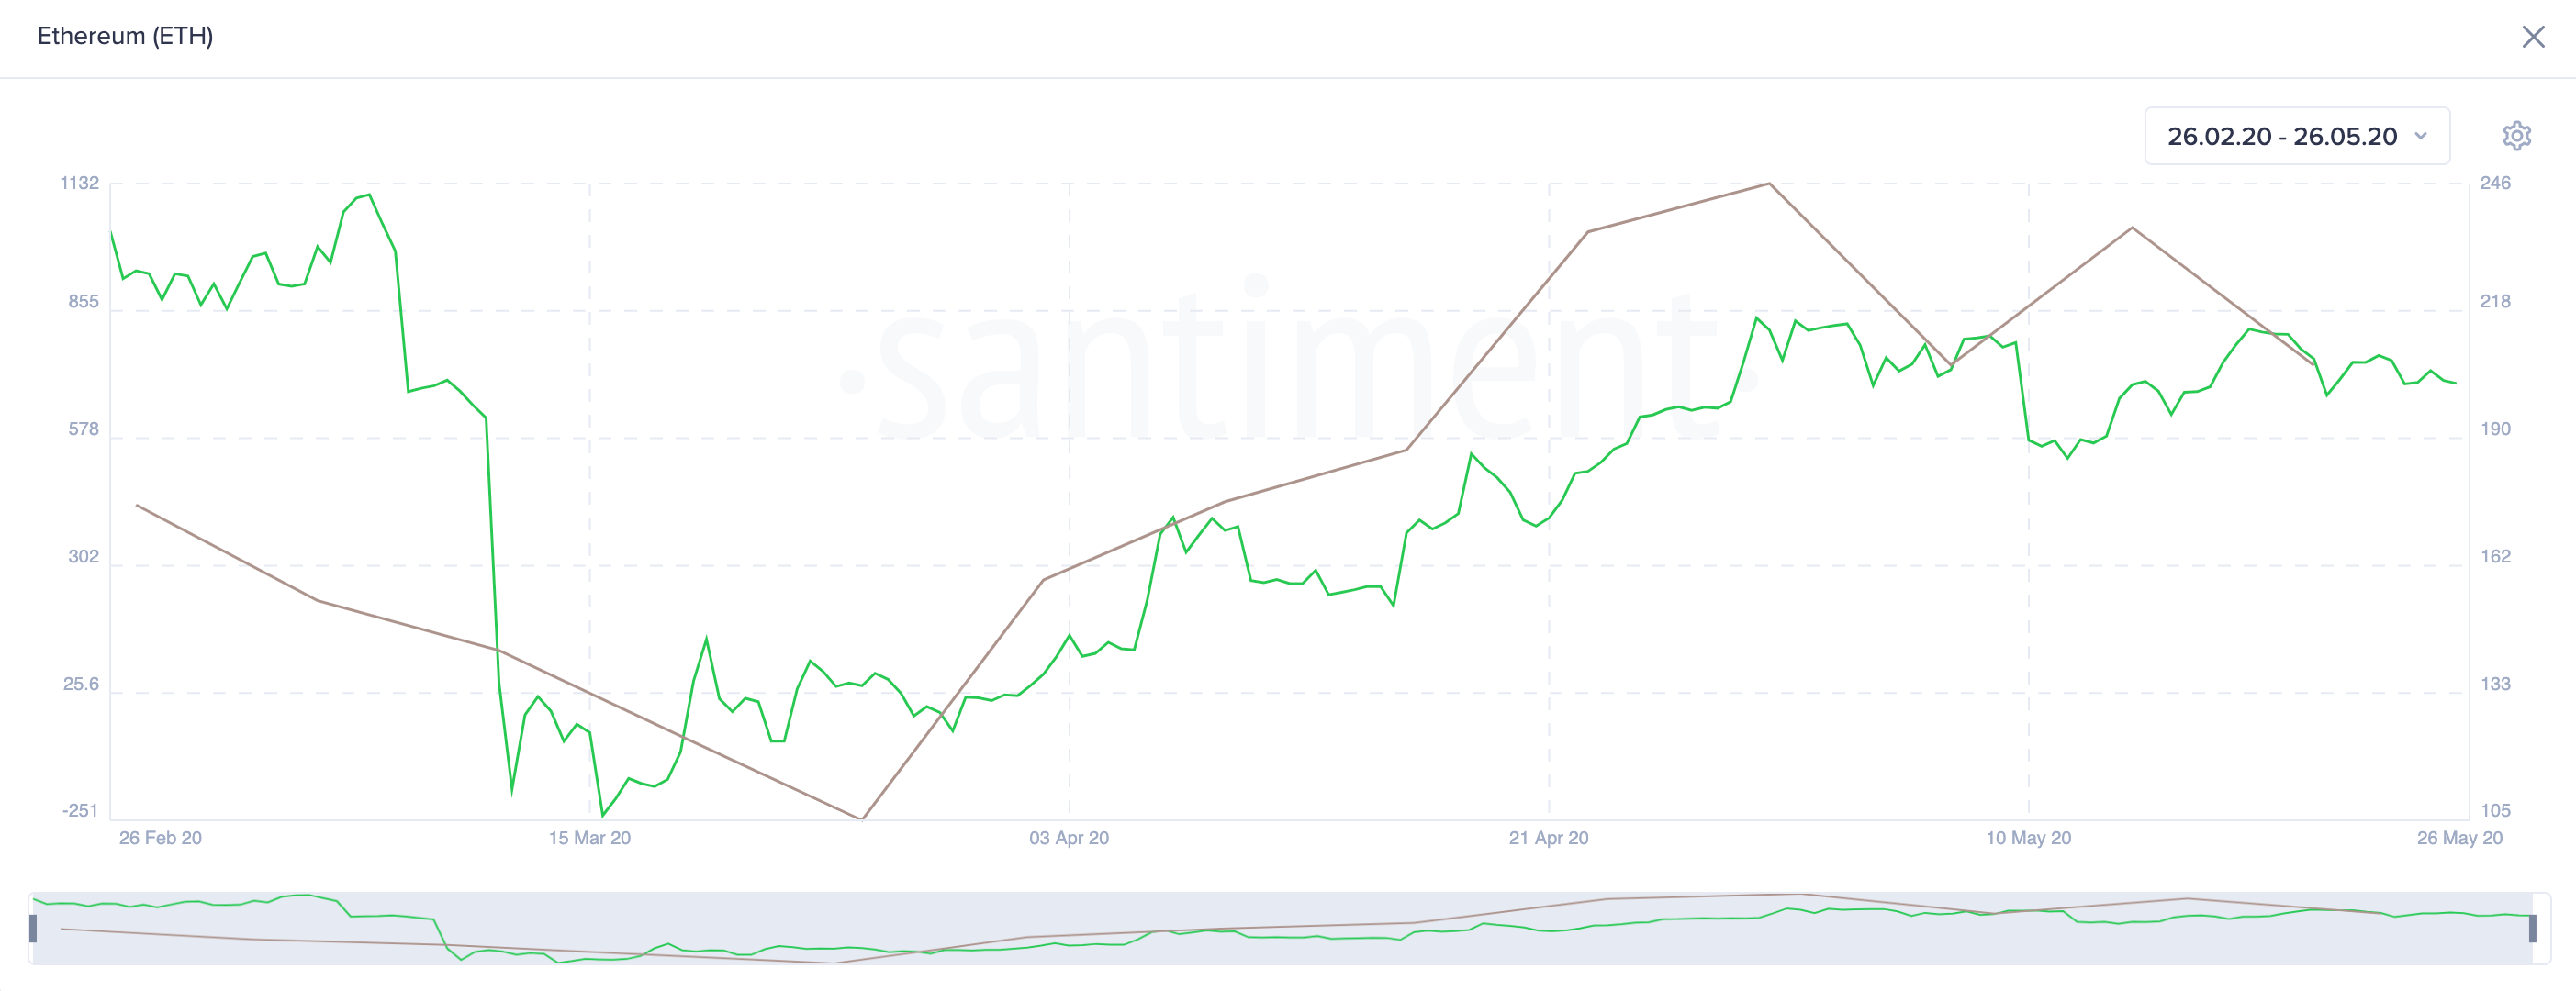
The changes in the number of followers on Ethereum’s official Twitter account adds credence to the bearish outlook. For over the past year, this gauge appears to be highly correlated with the price action of this altcoin.
Each time Ether’s Twitter followers’ count goes down, its price tends to follow.

Ethereum Twitter Changes. (Source: Santiment)
Now that this fundamental metric seems to have made a lower high on May 14, the odds for a bearish impulse increased substantially.
Key Support Levels to Watch Out
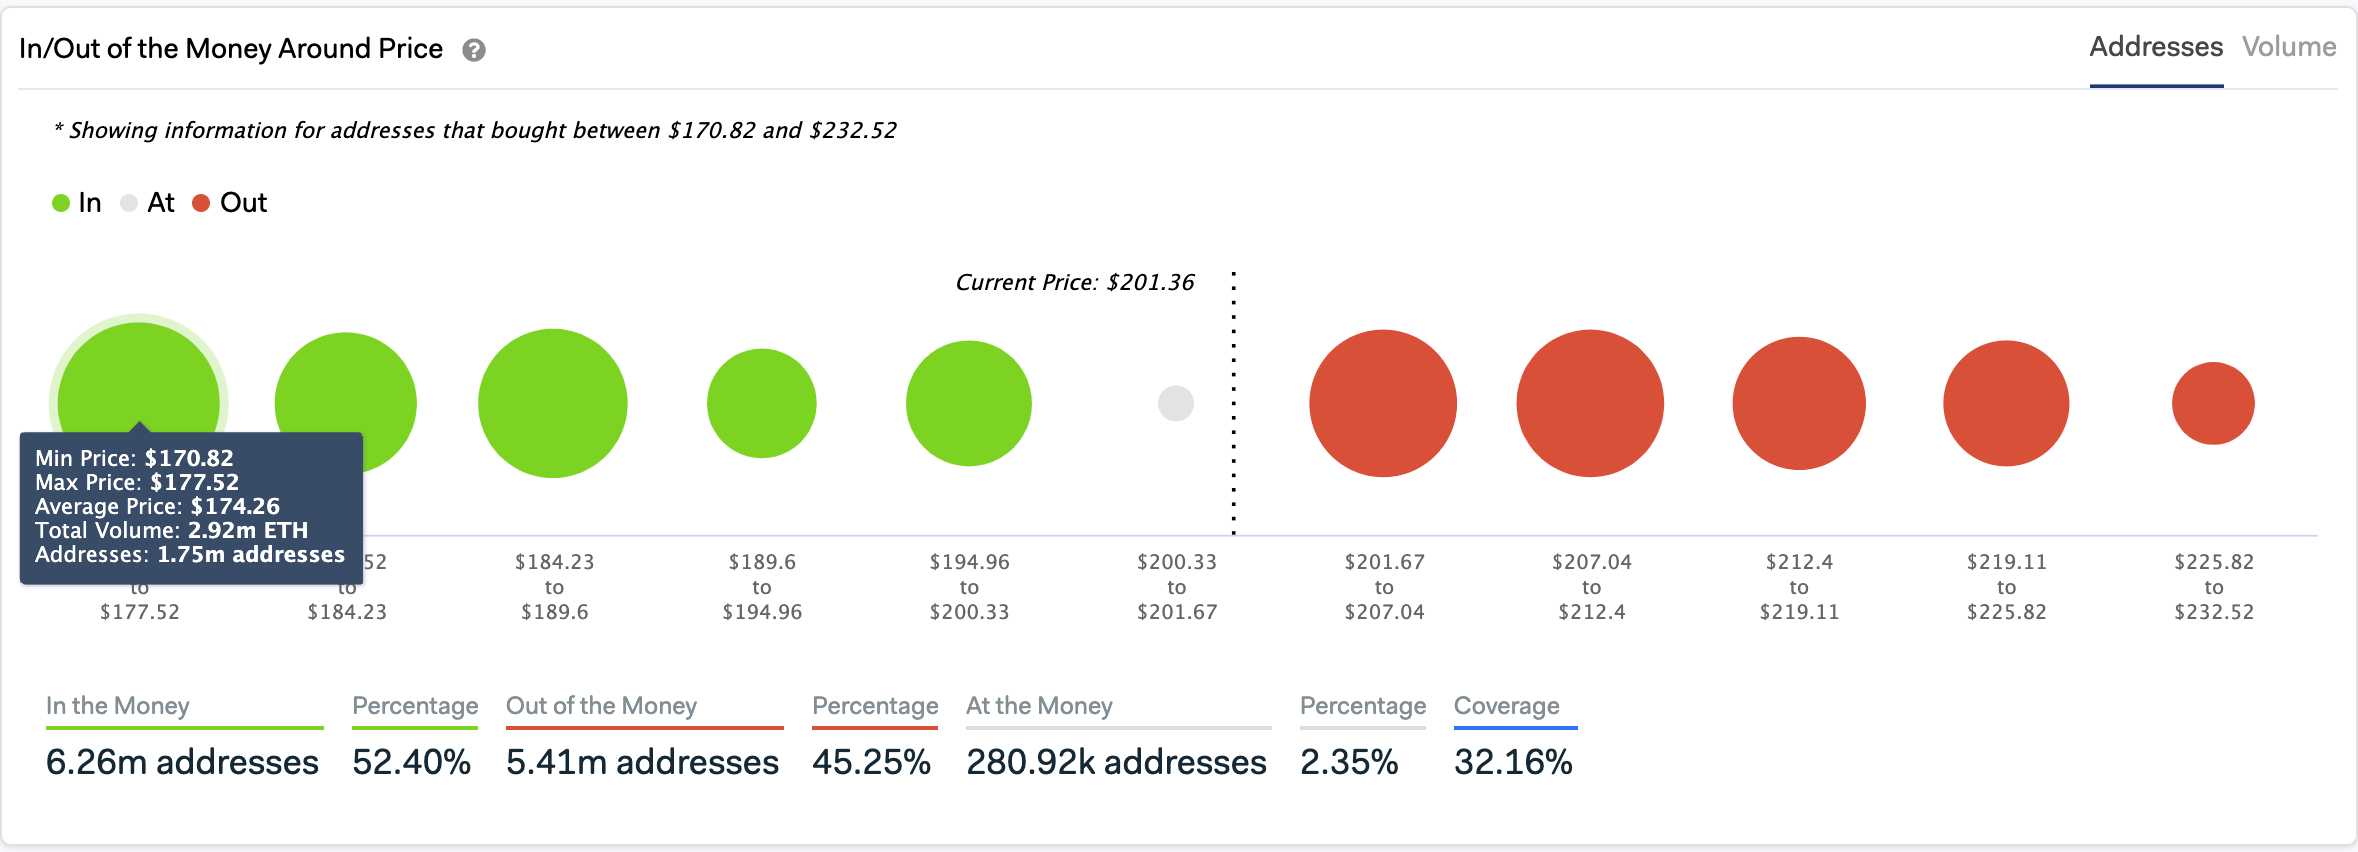
Out of all Ethereum addresses, more than 52% are currently “In the Money,” while over 45% are “Out of the Money,” according to IntoTheBlock’s “In/Out of the Money Around Price” (IOMAP) model.
These figures may indicate that as it was seen in Reddit, ETH holders are quite confident about what the future holds.
Considering the bearish signs presented by the aforementioned on-chain indexes, the IOMAP could help identify areas of support in the event of a correction. A simple glance at this indicator shows that the most significant supply barrier sits between $171 and $177.5.
Here, over 1.75 million addresses bought nearly 3 million ETH, which could serve as strong support.

In/Out of the Money Around Price. (Source: IntoTheBlock)
On the flip side, there is a significant resistance barrier between $202 and $226 that could prevent Ether from reaching its upside potential.
Only time will tell whether support or resistance will break first to provide a better idea about where Ethereum is headed next.
Featured Image from Shutterstock
