Bitcoin dropped its valuation for the 2nd consecutive week as it slumped before the $9000 level. The correction period is evident. across the collective industry as the early-month bullish momentum continues to become a distant memory.
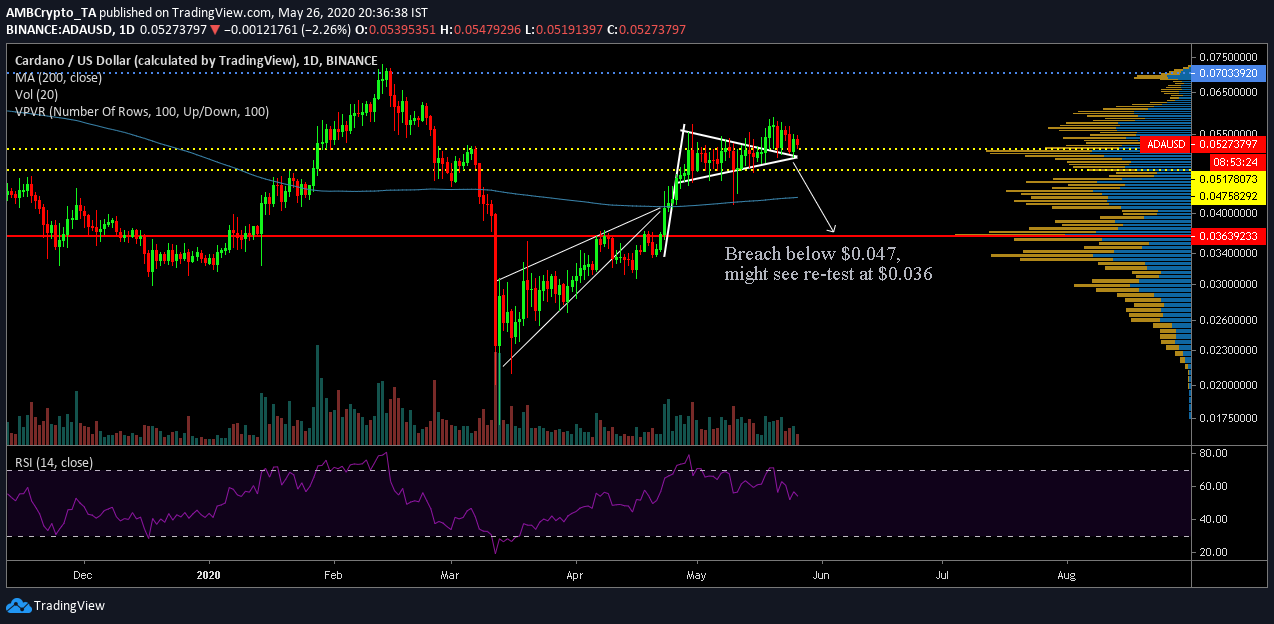
Maintaining a strong position above the immediate support of $0.0517, the asset was priced at $0.0527.
Cardano 1-day chart
ADA/USD on Trading View
It can be observed that Cardano’s price has noted a minor decline over the past 7-days. The coin managed to breach resistance at $0.044 on 28 April, but since then, it has recorded strong sideways movement between $0.047 and $0.052.
After the asset registered a breakout from its bullish pennant pattern, it has maintained a strong spot above support at $0.0517. However, the decline over the week cannot be ignored. Assuming the bears managed to dictate the price, a re-test at $0.047 appears likely. However, VPVR indicated continued support at $0.051.
The main bullish indicator here is the fact the ADA has maintained a price position above its 200-Moving Average (blue line), unlike some of the top altcoins such as Ethereum.
The possible bearish outcome?

ADA/USD on Trading View
Considering the absence of momentum, any exhaustion of buying pressure may allow the coin to depreciate to $0.036. A lack of strong support besides the 200-Moving Average at $0.044 may entertain the possibility of a drop to a price range preceding the April 28th rally.
Relative Strength Index continued to suggest an upper hand for the buyers but the buying pressure had started to decline at the press time. As we enter the last month of Q2 2020, the asset faces stiff pressure to maintain position above its immediate support in order to maintain its overall bullish demeanor going into the 2nd half of 2020.
