
XMR Price Analysis – March 27
The XMR bears took over the market after the bullish movement that occurred a few days ago, the price of Monero begins a downward movement.
XMR/USD Market
Key Levels:
Resistance levels: $56, $61, $66
Support levels: $36, $31, $26
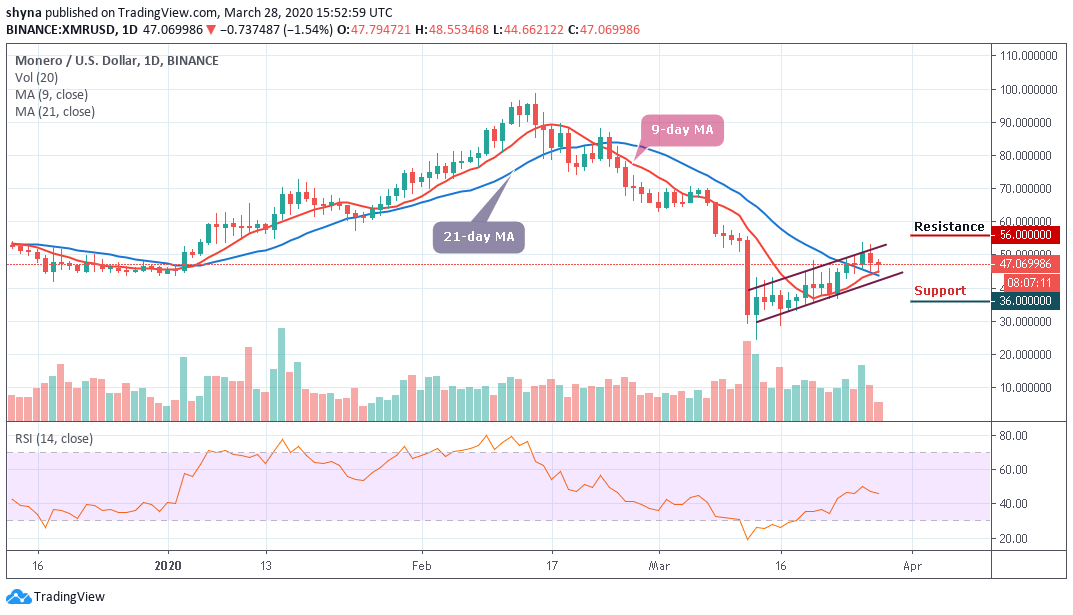
At the time of writing, XMR/USD drops from $48.61 to $45.00 and may drop further if the price breaks below the 9-day and 21-day moving averages within the ascending channel and may likely cross the lower limit of the channel. Therefore, this may delay the coin to reach the potential resistance levels at $56, $61 and $66 respectively.
Moreover, in case the bulls fail to protect the support level at $44, the price may go down to $36, $31 and $26 which are the next support levels. However, as the technical indicator indicates, the RSI (14) signal may still move below the 47-level, meaning that more bearish movement may come to play.
XMR/BTC Market
Against BTC, Monero (XMR) is still looking bullish as price rises above the 9-day and 21-day moving averages at 7638 SAT. Now, the bull appears to be controlling the market, and we can expect the price to rise to 8300 SAT and 8500 SAT resistance levels while the coin is currently changing hands at 7552 SAT.
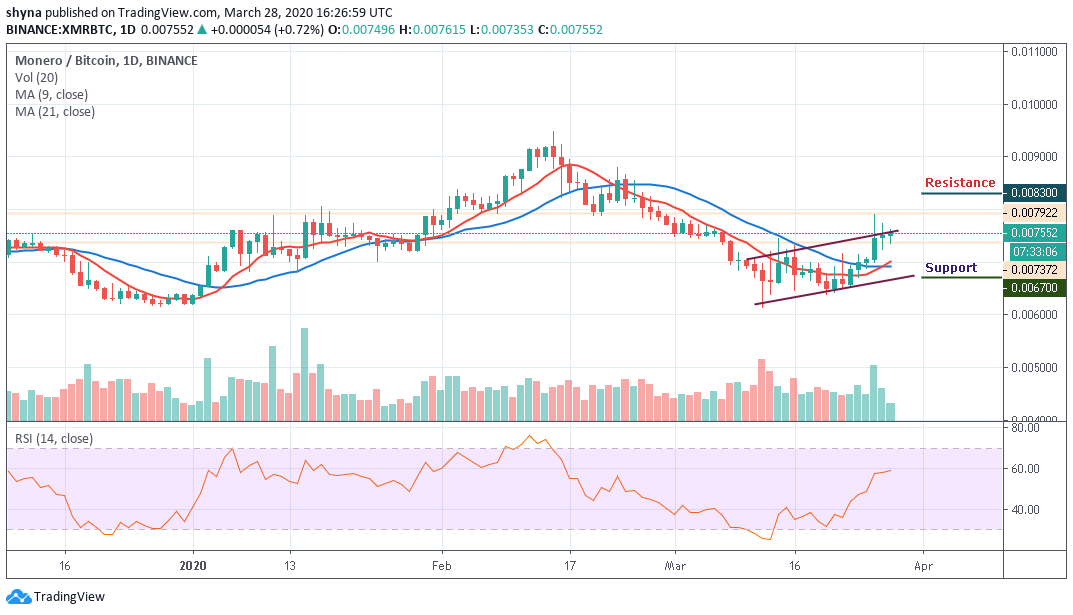
However, if the sellers push the price beneath the current 7552 SAT, the next level of support is located at 7100 SAT and more support may be found at 6700 SAT and 6500 SAT. The trading volume has significantly increased while the RSI is moving to cross above the 60-level for more bullish signals.
Please note: Cryptovibes.com is not a financial advisor. Do your research before investing your funds in any financial asset or presented product or event. We are not responsible for your investing results.