
It’s been exactly 46 days since the Crypto Collective Industry suffered its devastating crash on 12 March 2020. Since then, all the major assets have been in a place to get their act together. At press time, the top ten assets remain very close to recovering their losses during the March 12-13 conundrum.
Litecoin was one of the most impacted assets during the week, but it has been able to undergo a significant rise over the past month. At press time, Litecoin was worth $45, with a market cap of just under $3 billion in charts. With a trading volume of $4.73 billion, it can be concluded that the Litecoin market is fairly active.
Litecoin 1-day chart
Observing Litecoin’s 1-day chart, it can be seen that the asset has been very steady for most of April. The 7th largest asset breached resistance at $34, $38, and $40, and is currently just above immediate support at $44.
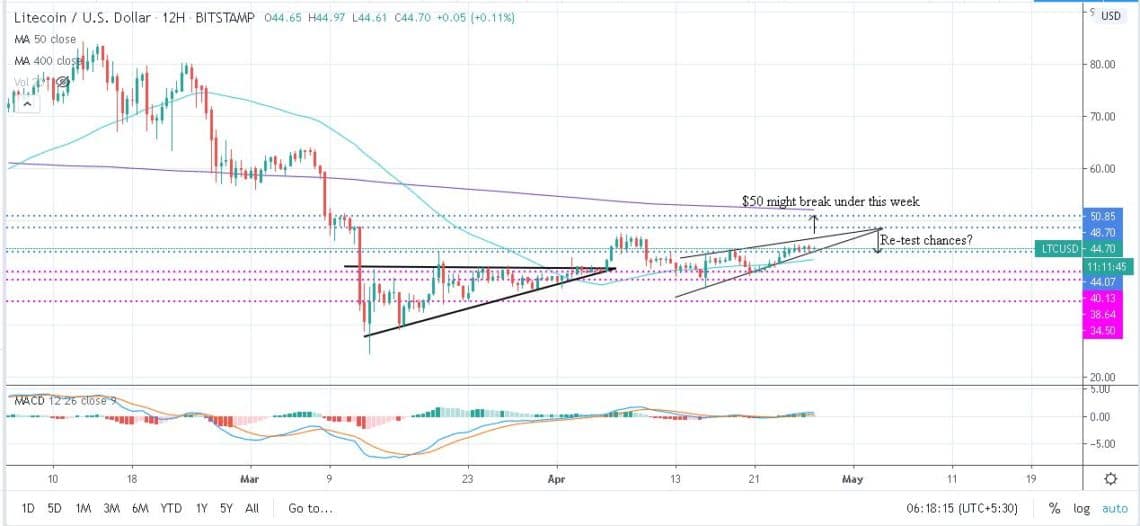
From the chart, it can be observed that the Litecoin price indicated the formation of an ascending triangle pattern from 12 March to 6 April, which led to a bullish breakout on the 7th of this month. The price went all the way up to $47, but another phase of the correction brought it back under resistance $44.
At the time of time writing this article, Litecoin is currently following the price pattern of a rising wedge which indicated that a bearish pullback is going to take place for the asset. However, it is important to take a few market indicators under consideration.
The 50-day Moving Average is under the candlesticks, which is a bullish sign and the MACD line suggested that the bullish momentum is very high in the charts.
Hence, a bearish breakout might not take place immediately.
Case 1: Bull run to $50 under a week
Litecoin could see the elusive $50 range in this week as completely nullify all its losses from the crash on March 12th but it will be followed by a correction period down to $48, and then a period of sideways movement might take place as well.
Case 2: Re-test down to $44 before $50 range bullish run
Now, considering the rising wedge pattern holds strong in the chart, Litecoin might undergo a pullback down to $44 before it touches $50. A strong indicator for this scenario is the 200-Moving Average, which continues to be strong resistance in the chart over the long-term.