
Investment thesis
Bitcoin USD (BTC-USD) hardly requires an introduction. The crypto asset has made regular headlines in the news in the past years, as the price of the asset fluctuated strongly.
In this article, we will present a classic trend-following strategy in which the buy & sell signals will be generated automatically by a set of predetermined rules. We will execute a number of backtests to see whether such a strategy can be beneficial for investors/traders/speculators who would consider investing in Bitcoin.
After these backtests have been executed, we will execute an out-of-sample test to see whether the results would have sustained throughout 2020.
Historical performance of a Buy & Hold strategy
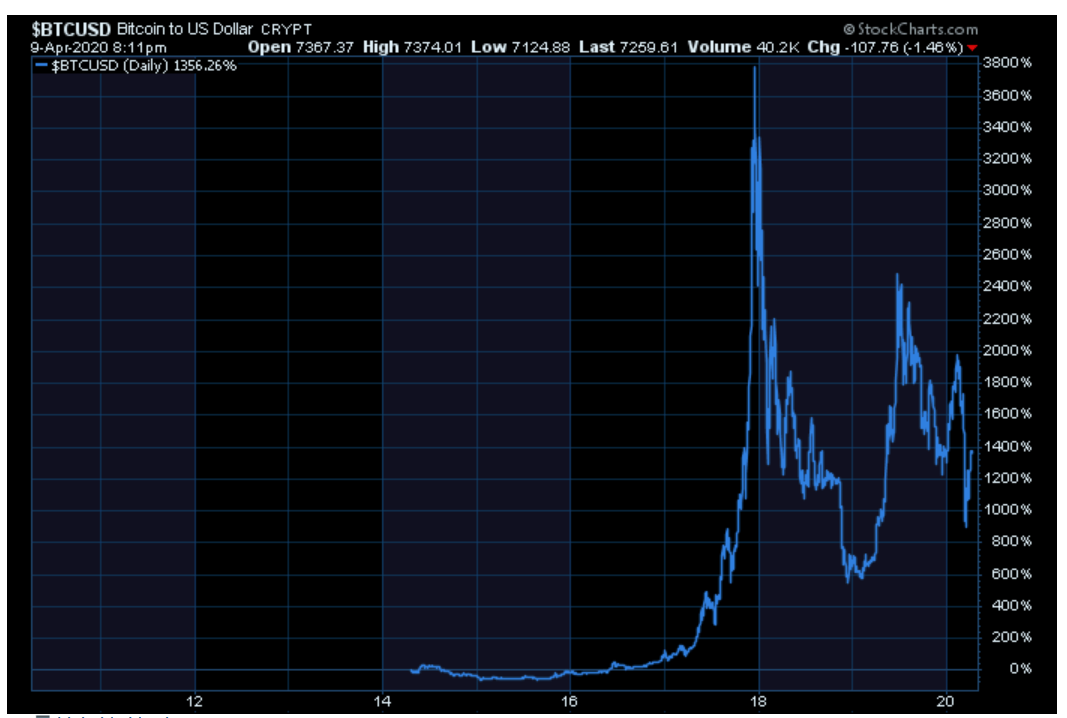
Investing in Bitcoin is not for the faint of heart. If one would have started purchasing Bitcoins back in 2014, you would have gone through a spectacular uprise, only to see the value of your cryptocurrency come back strongly in value just as quickly.
The investment would have slowly appreciated from 2014 to 2016 before it started to increase exponentially in 2017-2018. After this, the value of the cryptocurrency crashed down only to rise again thereafter.
A simple buy-and-hold strategy in which one would have purchased Bitcoin for $10,000 on the start date (17 September 2014) and would have held the investment until today (9 April 2020) would have had the following equity chart
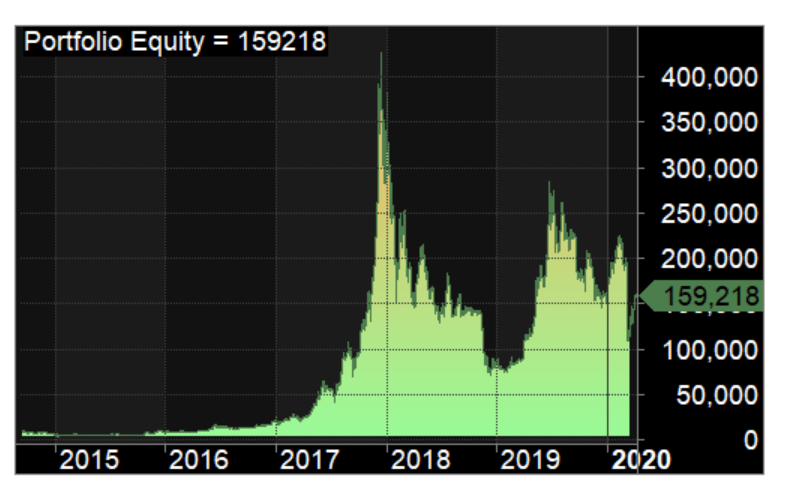 Source: Created by the author
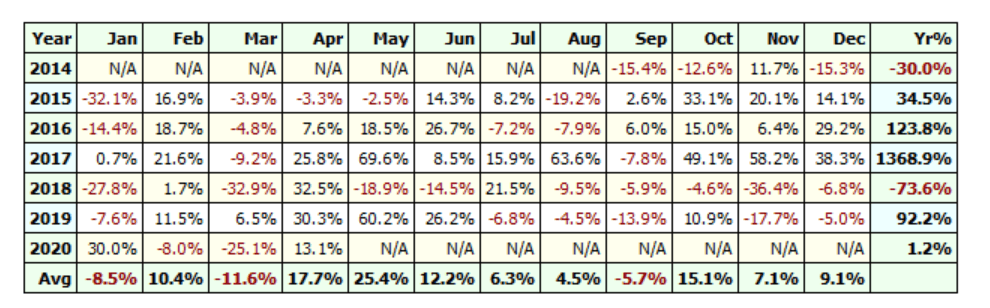
The returns on a month-to-month basis would have fluctuated substantially as well, sometimes going up with 63% only to decline later with 33%.
In the chart below the underwater equity is demonstrated, showing to losses one would have endured by holding BTC in the portfolio throughout the past years

That’s right, the maximum drawdown (the biggest decline from top to bottom) would have been 83%. If you would have been unlucky enough to have purchased BTC at the top and face this 83% loss, you would need a price appreciation of approximately 488% just to get back to even.
Conclusion: It is clear at this point BTC is able to appreciate strongly in price and decline just as fast again. Looking at the underwater equity chart, showing the 83% price decline, we assume this price volatility is too elevated for most investors to accept.
In the section here below, we will backtest a classic trend-following strategy that has been frequently mentioned for commodity and stock investments. We will validate whether this strategy holds any merit for speculators/traders who want to risk part of their equity in Bitcoin.
Trend-Following Strategy
The strategy we will use to time our entries & exits signals will be a moving average crossover system. In total 4 trading systems will be backtested:
1) SMA strategy – A simple moving average crossover strategy: We buy BTC once it crosses over its simple moving average. BTC will be sold once it declines below the simple moving average. Only 1 parameter will be used: (NYSE:N) The number of days used to calculate the simple moving average.
2) EMA strategy – An exponential moving average crossover strategy: We buy BTC once it crosses over its exponential moving average. BTC will be sold once it declines below the exponential moving average. Only 1 parameter will be used: The number of days, N, used to calculate the exponential moving average.
3) DSMA strategy – A double simple moving average crossover strategy: We will use 2 simple moving averages, a fast one (SFMA) and a slower one (SSMA). Once the faster moving average crosses over the slower moving average we will purchase BTC. We will exit this long position in BTC once the faster moving average crosses below the slower moving average.
4) DEMA strategy – A double exponential moving average crossover strategy: We will use 2 exponential moving averages, a fast one (EFMA) and a slower one (ESMA). Once the faster moving average crosses over the slower moving average we will purchase BTC. We will exit this long position in BTC once the faster moving average crosses below the slower moving average.
The goal of the Strategy
The main target of this experiment is to run a number of trading simulations to come forward with a trading strategy which can benefit from the upward momentum of BTC, while the downside risk is reduced.
The results of the buy & hold strategy can be summarized as follows:

In order to establish a yardstick to measure the downside risk of the investment, we will look at the total drawdown during the investment (“Max Sys DD”). The lower, the better.
Backtesting Settings
- Starting equity = $10,000 (100% is invested in each trade, meaning all profits (or losses) will be reinvested on each new trade
- Buy prices and sell prices are based on the open prices
- Trades are initiated on the day after the entry/exit signal has been generated (in order to avoid look-ahead bias).
- No commissions are taken into consideration
- Time horizon: September 2014 – December 2019
- The platform used: Amibroker
Strategy 1: SMA Strategy
In the first setup, we will backtest what would have happened in case someone bought Bitcoin after the price crossed above the simple moving average (calculated over N days). A moving average that is typically used here for stocks is the 50 or 200-day moving average. Here we will backtest the trading strategy for N = (10, 20, 30, …, 200). The closing prices are used to calculate the moving averages and if a trade signal occurs, the trade will be initiated at the closing price of the next day.
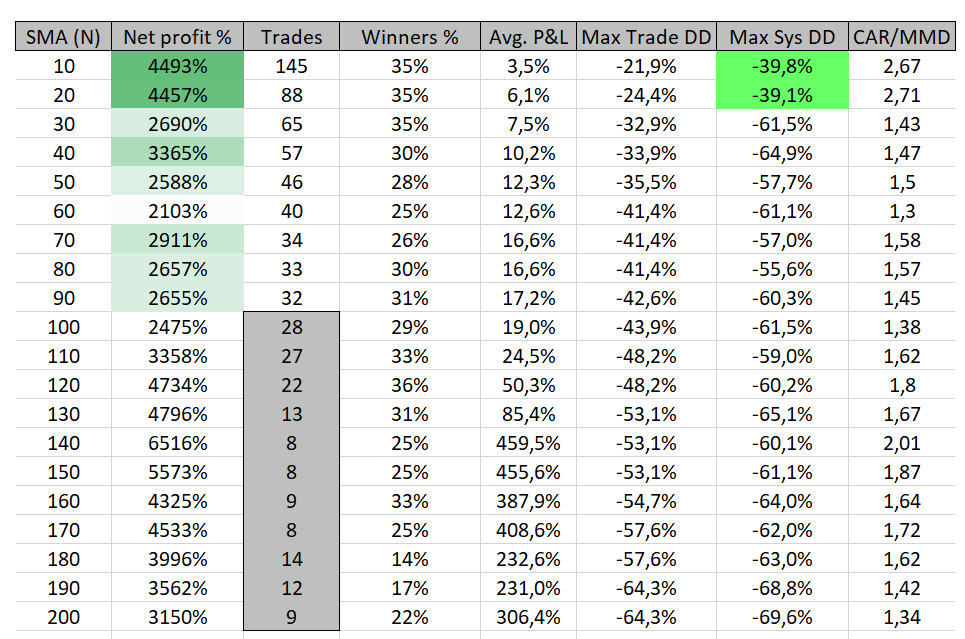
From this table we can see the following:
- When we use mover than 90 days to calculate the simple moving average, less than 30 trade signals are generated. This results in a sample size that is too small to draw any statistically relevant conclusions.
- The best results are achieved for moving averages based on a 10-day or 20-day count. These results also achieve the lowest drawdowns.
- The number of winners is relatively low, which is what we can expect as these moving average strategies are prone to false breakouts. The goal of this trading system is to capture the major part of a trend, not to be right on each individual trade.
Strategy 2: EMA Strategy
In this strategy we do exactly the same as under Strategy 1, only now will we use an exponential moving average in which the more recent price data will have a larger impact on the calculation of the moving average.
The results can be found in the table here below

The main findings are similar to those of Strategy 1:
- We can maximally use 120 days to calculate the exponential moving average
- Best results are achieved for lower day counts, such as 10 days or 20 days. Only these parameters result in decent lower maximum drawdowns.
- The strategy will generate a lot of losing trades, but the main goal is being achieved: capture the majority of any uptrend and lower the downside risk while doing so.
Strategy 3: DSMA Strategy
We will use 2 simple moving averages: a fast one (SFMA) and a slow one (SSMA). If SFMA crosses above SSMA we buy Bitcoin on the opening price of the next day. If the faster average crosses below the slower average, we will exit the deal on the opening price of the next day.
The results can be found in the table here below. This time I have sorted the results based on the number of trades the backtest generated (the top 20 is shown):
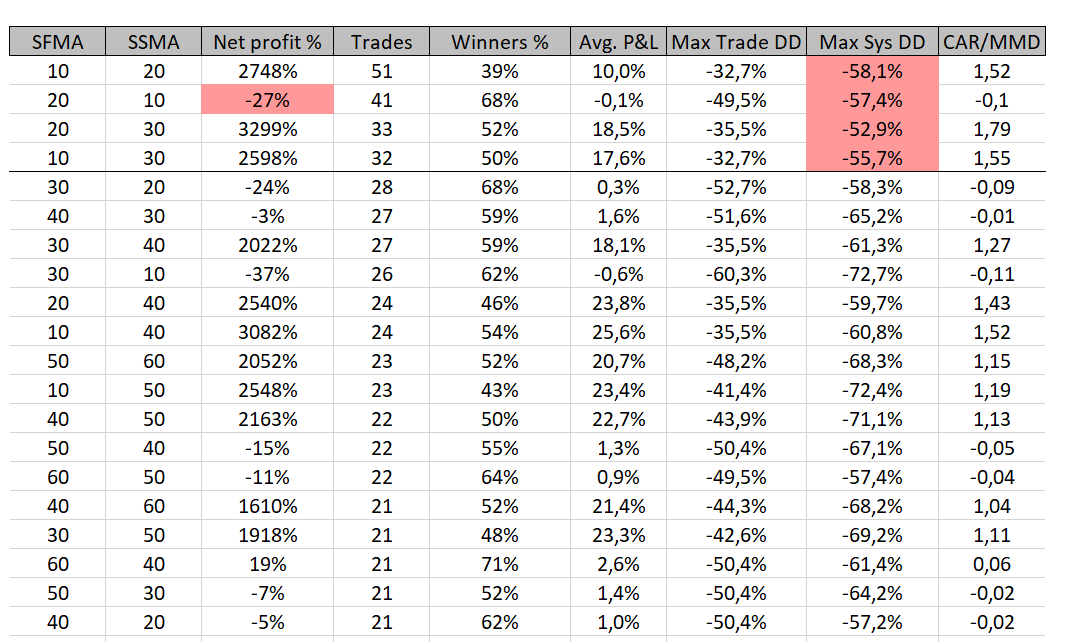
That’s right, only 4 backtests resulted in more than 30 trades. The results are rather poor, the maximum drawdown is still high and the total net profit % is poor compared with the same results from strategy 1 & 2. We are not going to investigate this strategy further at this point, as the number of trades generated is just too limited to be taken seriously.
Strategy 4: DEMA Strategy
We can be short here, the results are very similar to the ones under Strategy 3:
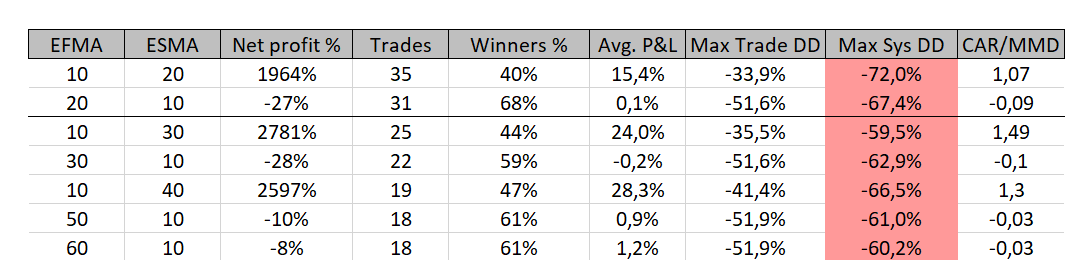
No need to further investigate Strategy 4 (nor Strategy 3), due to a lack of sufficient generated trades.
Out of Sample Testing
We will now have a look at how the trading strategies would have performed in 2020.
From the results discussed here above, it would have made sense to use a simple/exponential moving average crossover system to generate trades on Bitcoin, ideally only using 10 or 20 days to calculate the moving average.
In the table below we will see how the moving average strategies would have done in 2020:
Strategy 1: simple moving average crossover based on 10 & 20 trading days:

Strategy 2: exponential moving average crossover based on 10 & 20 trading days:
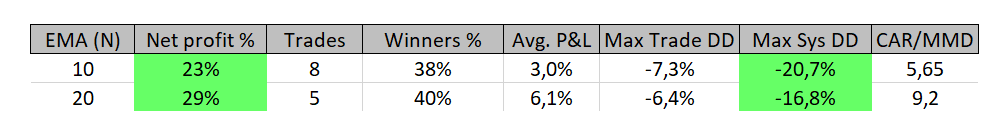 If we would have used the EMA crossover system with a parameter of 20 days in the year 2020, the following trades would have been generated:

This is what you would have gotten following the buy & hold strategy (you bought Bitcoin on 1 January 2020 and sold it on 9 April 2020):
 The buy & hold strategy would have resulted in a lower Net Profit even though one would have faced again a large drawdown of 52%
Conclusion:
– Both the simple & exponential moving average trading systems would have resulted in a higher net profit in 2020
– The risk of the 4 out-of-sample backtests is low, compared with the risk of a buy & hold strategy (similar to what we observed with the in-sample backtests).
– Even though the timeframe was rather short (only 3 months and a few days), both trading systems generated a number of signals which could have been easily executed at the opening price of the next day.
Remark: Please keep in mind any investment in Bitcoin is exposed to a high degree of risk. While the strategies presented in this article demonstrate a method to lower the risk exposure, anyone investing in Bitcoin should always take the high-risk character of any cryptocurrency into consideration.
Disclosure: I/we have no positions in any stocks mentioned, and no plans to initiate any positions within the next 72 hours. I wrote this article myself, and it expresses my own opinions. I am not receiving compensation for it (other than from Seeking Alpha). I have no business relationship with any company whose stock is mentioned in this article.