- Ethereum price lags triangle breakout due to the immediate resistance at $160.
- The RSI and the MACD in the hourly range align in support of recovery targeting $180 and $200 respectively.
Ethereum price is trading at $159 after lifting off support at $150. Buyers are keen on resuming control in the wave of a fall from last week’s high at $176. The hourly chart shows Ethereum price trading above the moving averages. The 100 SMA is holding the ground at $158.10 while the 50 SMA is positioned at $157.11. A surge above $160 will open the door for a rally above $170 and toward the coveted $180.
Meanwhile, technical indicators are in the favor of the bulls starting with the RSI’s spike above 50 from levels slightly above the oversold. At the same time, the MACD has crossed into the positive region. A visible bullish divergence clearly shows they are in control. Besides, continued upward movement would cement the bulls’ influence and position on the market. Ethereum is also grinding closer to a triangle resistance whose breakout could boost it toward the hurdle at $170.
ETH/USD 1-hour chart
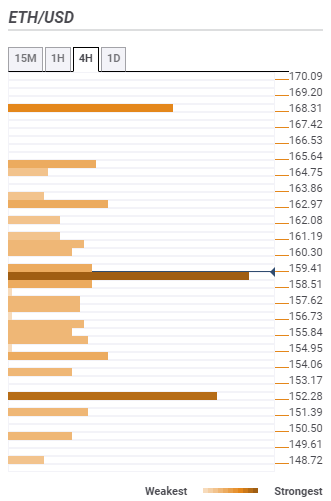
Ethereum price confluence support and resistance
Support one: $158.51 – Highlighted by the SMA five 15-minutes, SMA 100 1-hour and the previous low 16-mins.
Support two: $154.95 – Holds the SMA 100 15-mins and the Fibonacci 61.8% one-week.
Support three: $152.28 – Home to the Fibo 38.2% one-month and the Fibo 23.6% one-day.
Resistance one: $162.97 – Highlighted by the 38.2% one-week and the Bollinger Band 4-hour upper curve.
Resistance two: $165.64 – Suggested by the 161.8% Fibo one-day.
Resistance three: $168.31 – Highlighted by the SMA 50 one-day and the Fibo 23.6% one-week.

