
Cryptocurrencies continued climbing during the past weekend, as Bitcoin (+1.18%) moved from $7,500 to touch $7,700, and Ethereum (-0.17%) approached the $200 level. The top performers in the last 24 hours were DOGE (+5.5%), ADA (7.32%), WAVES(+7.32%), SC (+18.5%) and STEEM (+41.1%), whereas Tezos (-5.07%), RVN(-6.75%) and DGB(-21.22%) were the worst. In the Ethereum-based token sector, MKR led the gains of the top-10 cryptos, as BXK( +28.5%) lead the gains, followed by TRUE(+17.26%), FST(+16.15%), and SNX( +15.39%).
Fig 1 – 24H Crypto Sector Heat Map
The total market capitalization definitively crossed above the $209 billion that was the top-level since the beginning of the month and headed towards the $220B, where it bounced back and now is at $217.11B. We see the total cap making an ascending wedge that may be indicative of exhaustion of the trend. The traded volume was $42.726 billion, which is 14.8 percent higher than on Sunday, and the dominance of Bitcoin moved slightly down to 64.08%.
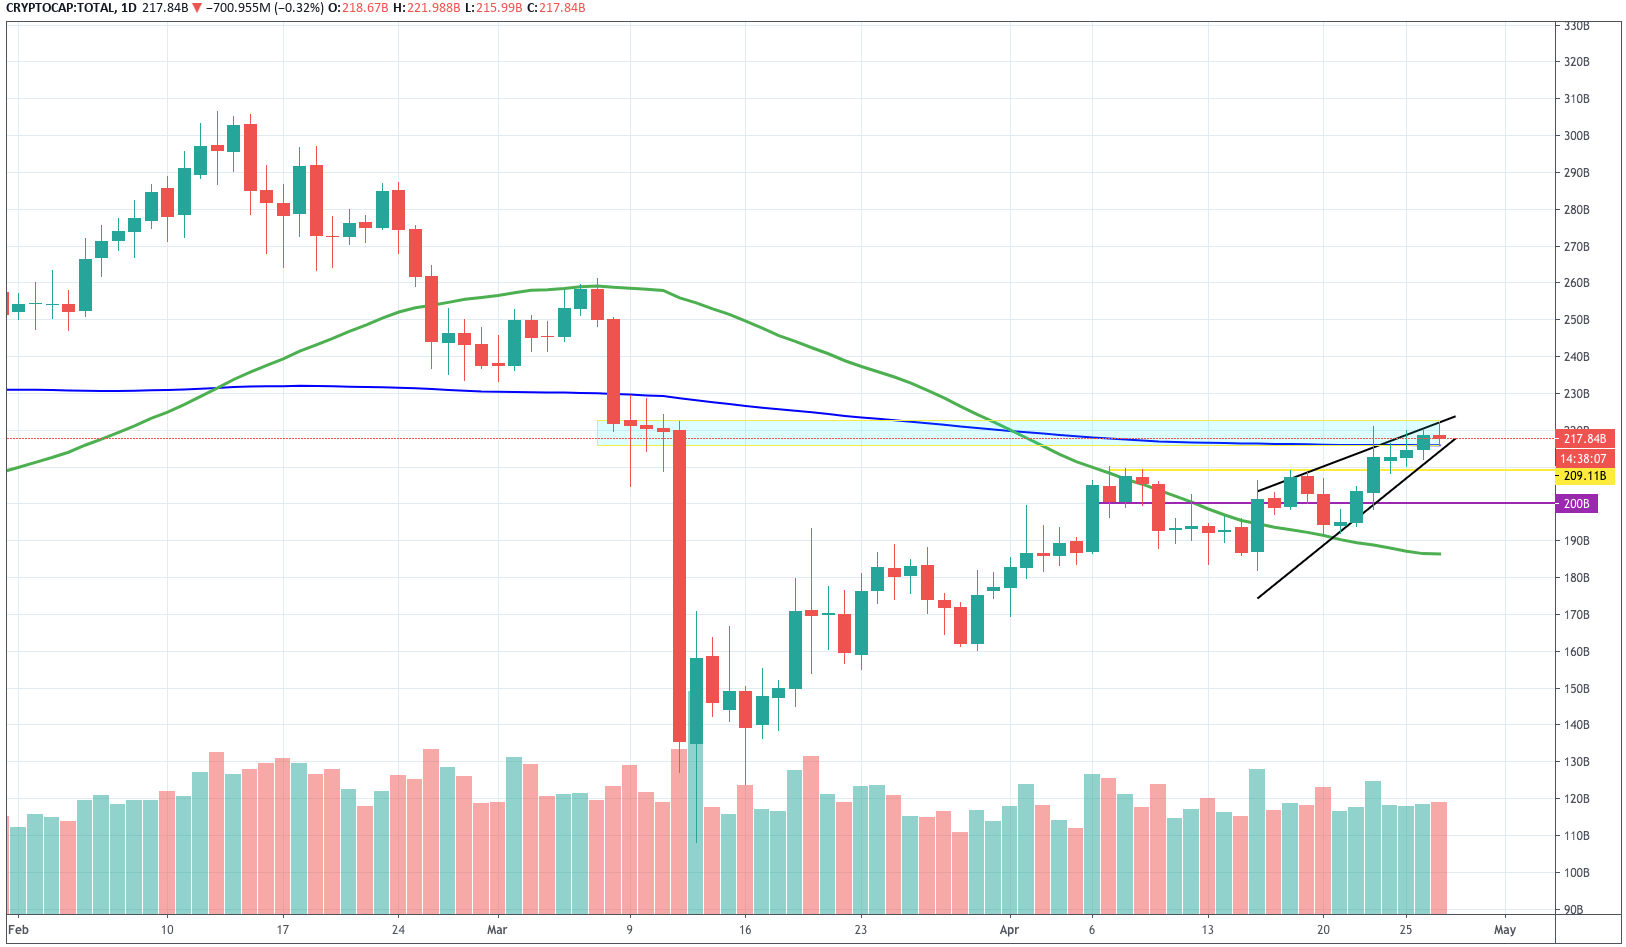
Fig 2 – Total Market Daily Chart
Hot News
According to a report by Cryptopotato, Greyscale Investments has bought nearly 50 percent of all mined Ethereum in 2020, as the firm got increased demand from institutional investors, as Ethereum 2.0 is raising widespread interest among institutions.
Bitcoin’s inflation rate is currently 6.65%, but soon, it will be halved to 1.8% in May. That put its rate a less than the targeted inflation rate most central banks set for their economies. An analyst pointed out that by lowering inflation, it would not require an increased demand to sustain the current price.
According to a Cryptobriefing article, A DeFi bug has frozen $30K worth of Ether in a smart contract forever because of a typo. This situation highlights the need for in-depth evaluations of smart contracts that investors can understand, not just the coders.
Technical Analysis – Bitcoin
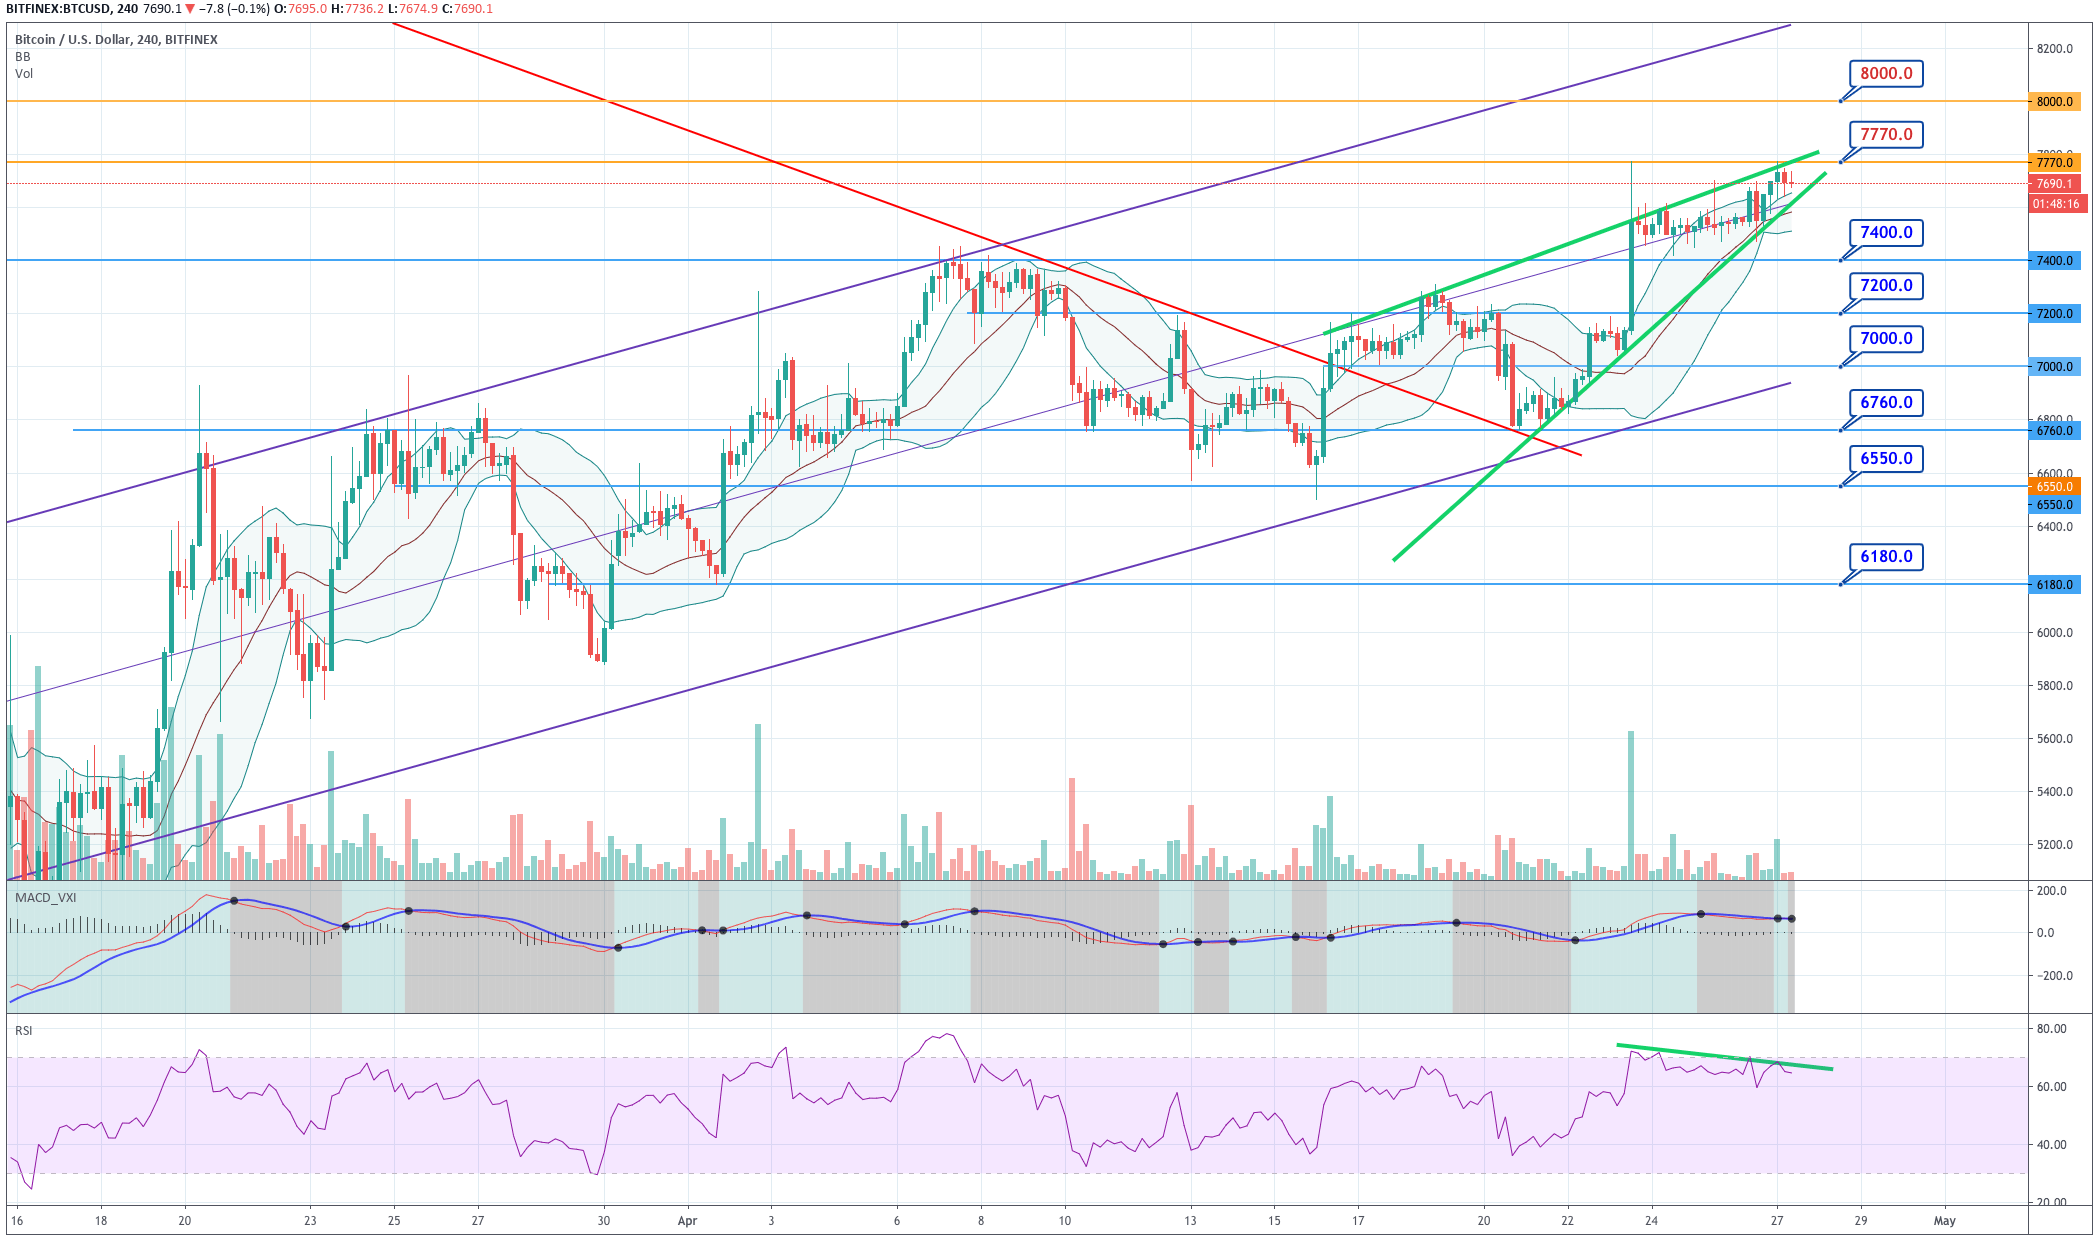
Fig 3 – Bitcoin 4H Chart
Bitcoin is making an ascending wedge-like structure, its price bouncing off the $7,770 level. BTC still moves with a bullish bias, and its price above the +1SD line of the Bollinger bands, but the ascending wedge and the RSI divergence makes us think that the upside potential is limited and that sellers step in at these levels. Thus, buyers will need more evidence to step in, such a close above $7,770. A break below $7550 could drive BTC price to test the $7,400 or, even, $7,300.
Standard Pivot Levels
|
SUPPORT |
PIVOT POINT |
RESISTANCE |
|
7,050 |
7,411 |
8,064 |
|
6,405 |
8,425 |
|
|
6,043 |
9,067 |
Ethereum
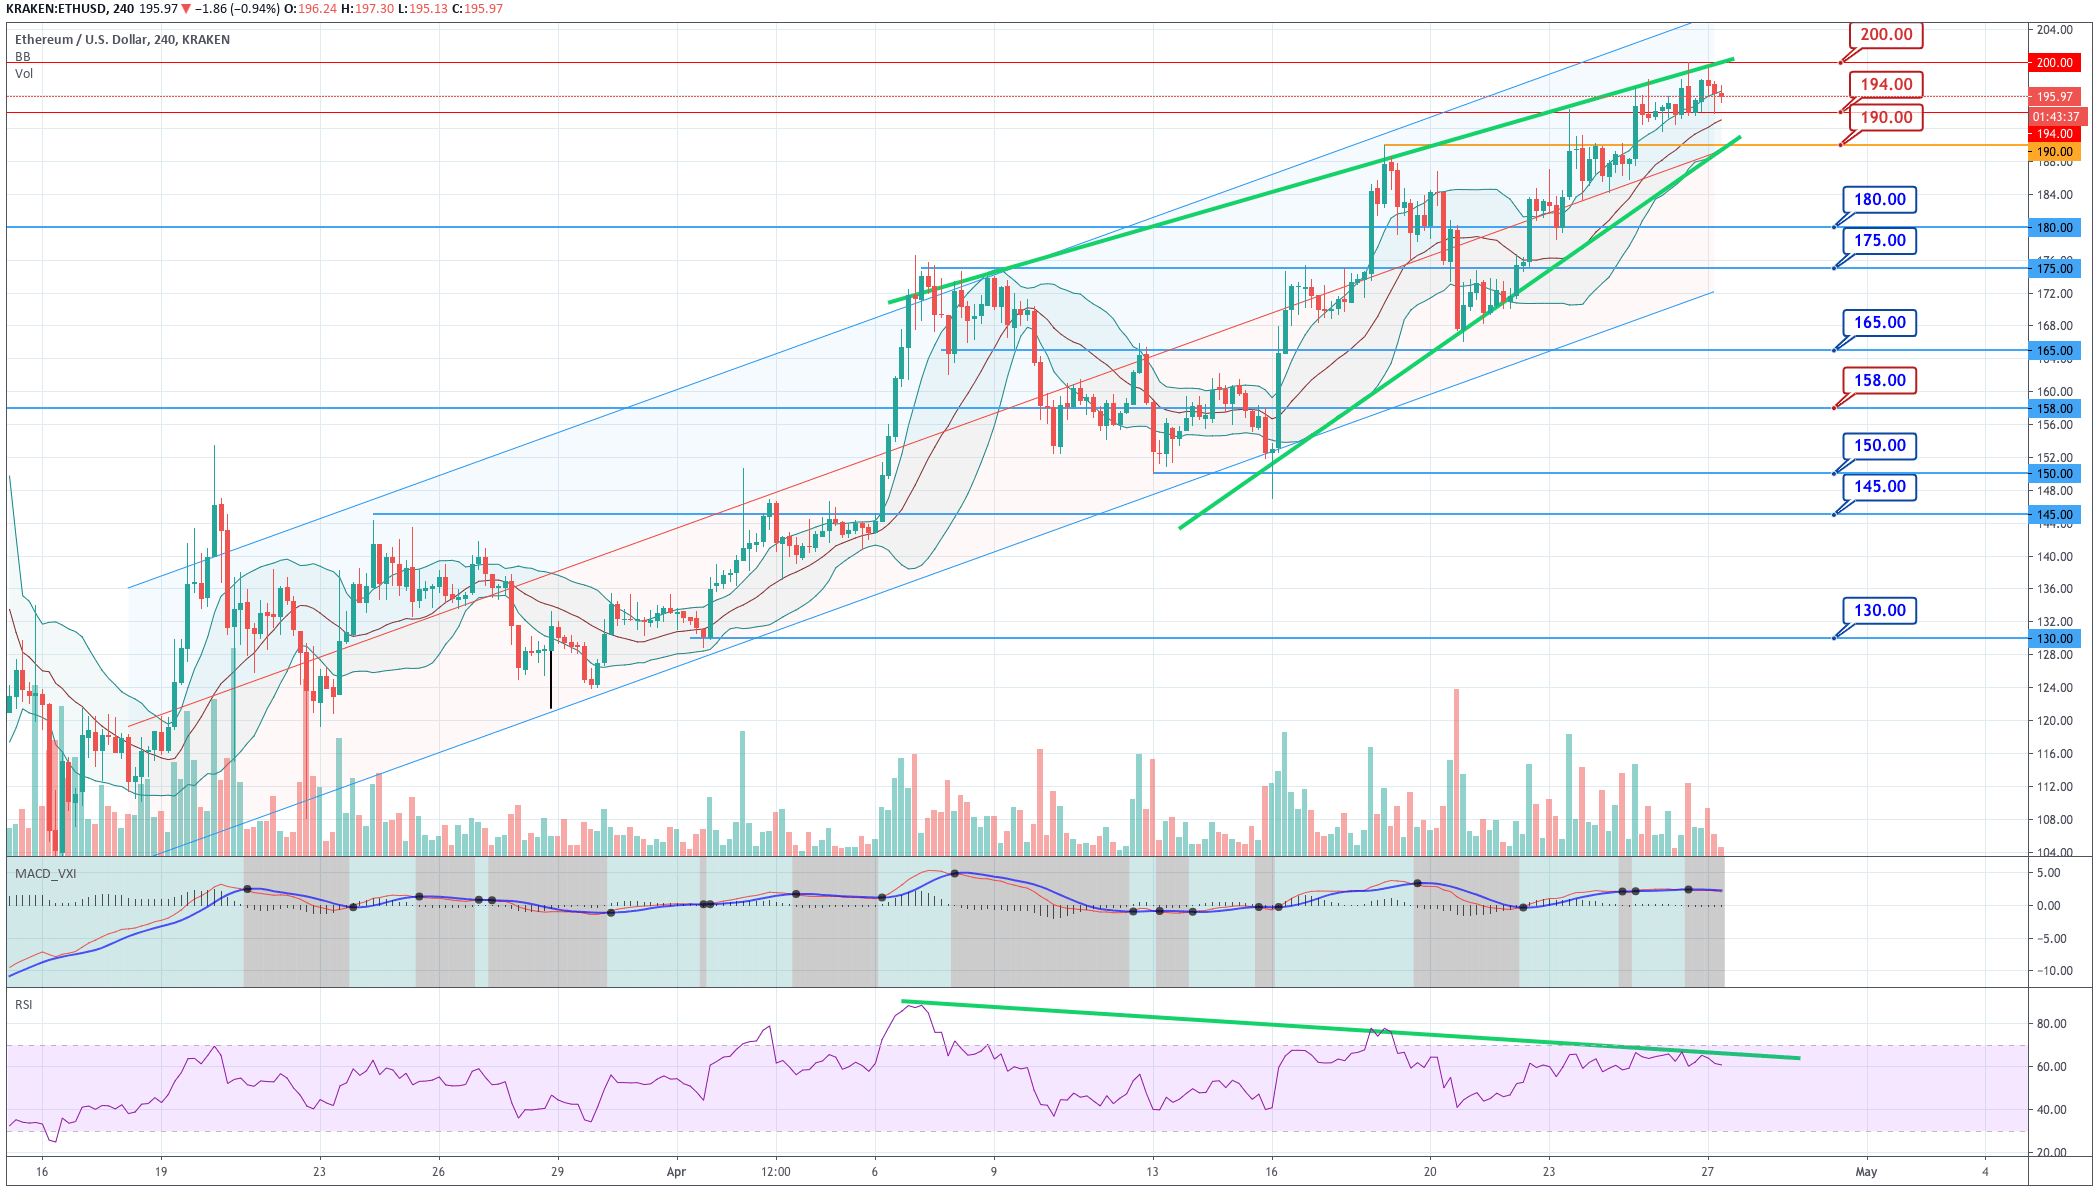
Fig 4 – Ethereum 4H Chart
Ether’s price is also making an ascending wedge that may limit its upside. The price has bounced twice at the $200 level in the last 24 hours. We see the price moving near the +1SD line. The Bollinger Bands and the upward channel lines point upwards. Thus, the underlying trend is bullish. But, on the other hand, the RSI divergence may indicate a short-term retracement to $190 or $180. Buyers must wait for a credible move above $200 to add positions.
Standard Pivot Levels
|
SUPPORT |
PIVOT POINT |
RESISTANCE |
|
176.5 |
188 |
210 |
|
155 |
222 |
|
|
143 |
243 |
Ripple
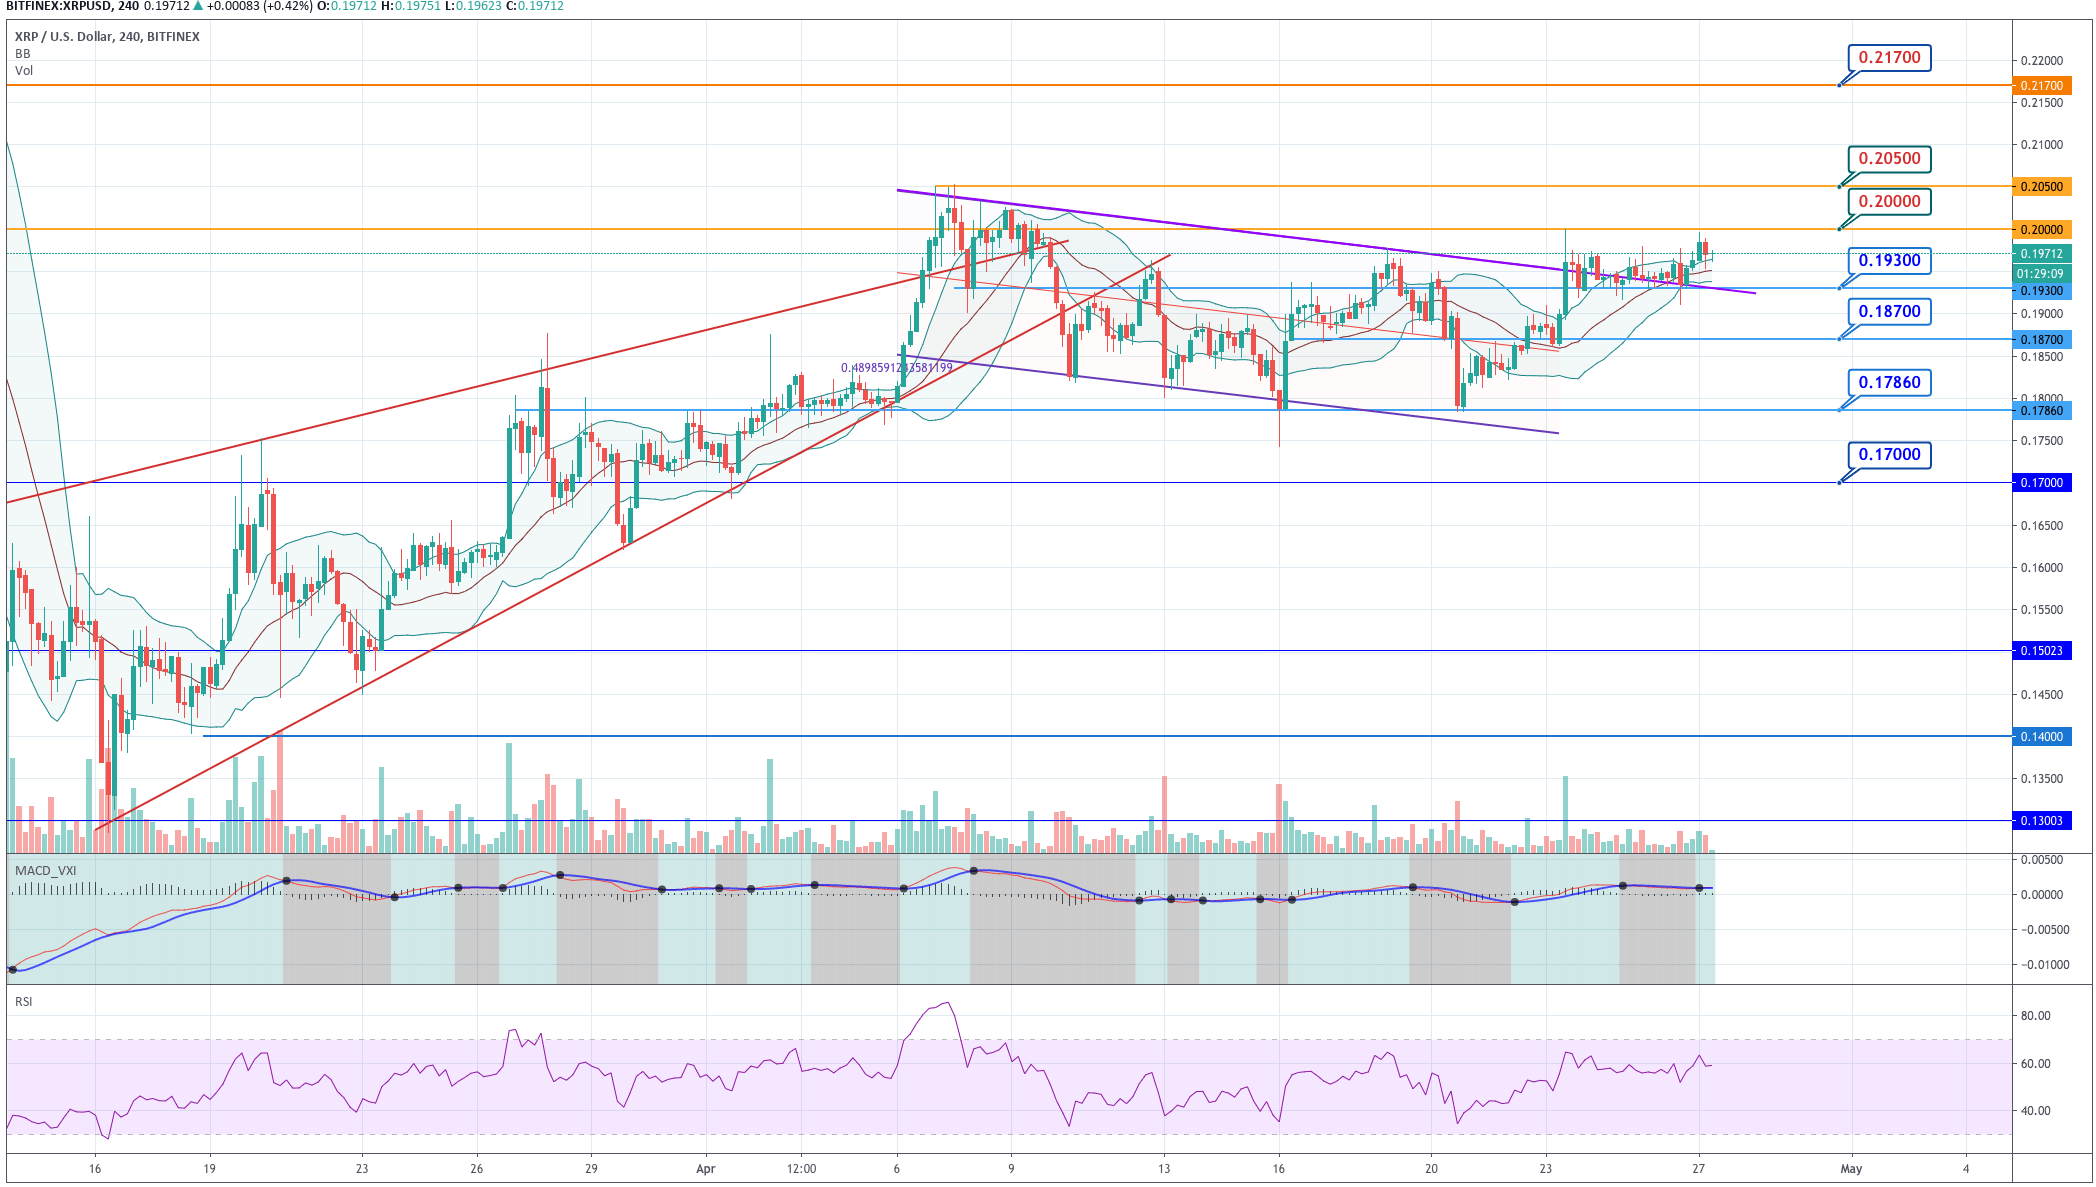
Fig 5 – Ripple 4H Chart
Ripple has broken its slightly descending channel to the upside, but it was stopped at $0.2. The action seems to seek more upsides. The price moves near its +1SD line, as the MACD turned up and made a bullish crossover above the zero-line. We see that currently, the price is retracing the last bullish candle, following a similar move in BTC and ETH. Buyers may wait for a break and close of the 0.2 level to enter or add long positions. A break below 0.193 can be what sellers wait for to go short.
Standard Pivot Levels
|
SUPPORT |
PIVOT POINT |
RESISTANCE |
|
0.1830 |
0.1915 |
0.2050 |
|
0.1695 |
0.2134 |
|
|
0.1610 |
0.2269 |