The sellers weren’t strong enough to break through the supports of the leading cryptos, and the price spent the last 24 hours recovering the levels previous to the last drop made on Monday’s early hours. The most optimistic is the Binance coin (+11.91%). Ethereum has a 24-hour gain of 3.65 percent. The rest of the leading cryptocurrencies move in the 2% range.
The Ethereum tokens are also mostly in the green, with BAT, CRO, and MKR leading the top-cap gains of about 2.5 percent. Also worth mentioning ENJ (+6%), QNT (+6.22%), DX(+6.69%) and BHT(+16%).
The market capitalization is currently $193.772 billion, about $5 billion higher than on Monday’s morning, with a 24H traded volume of $35.214 billion, which is about $5 billion and 12.5% less than on Monday, whereas the dominance of Bitcoin is kept at 64.25 percent.
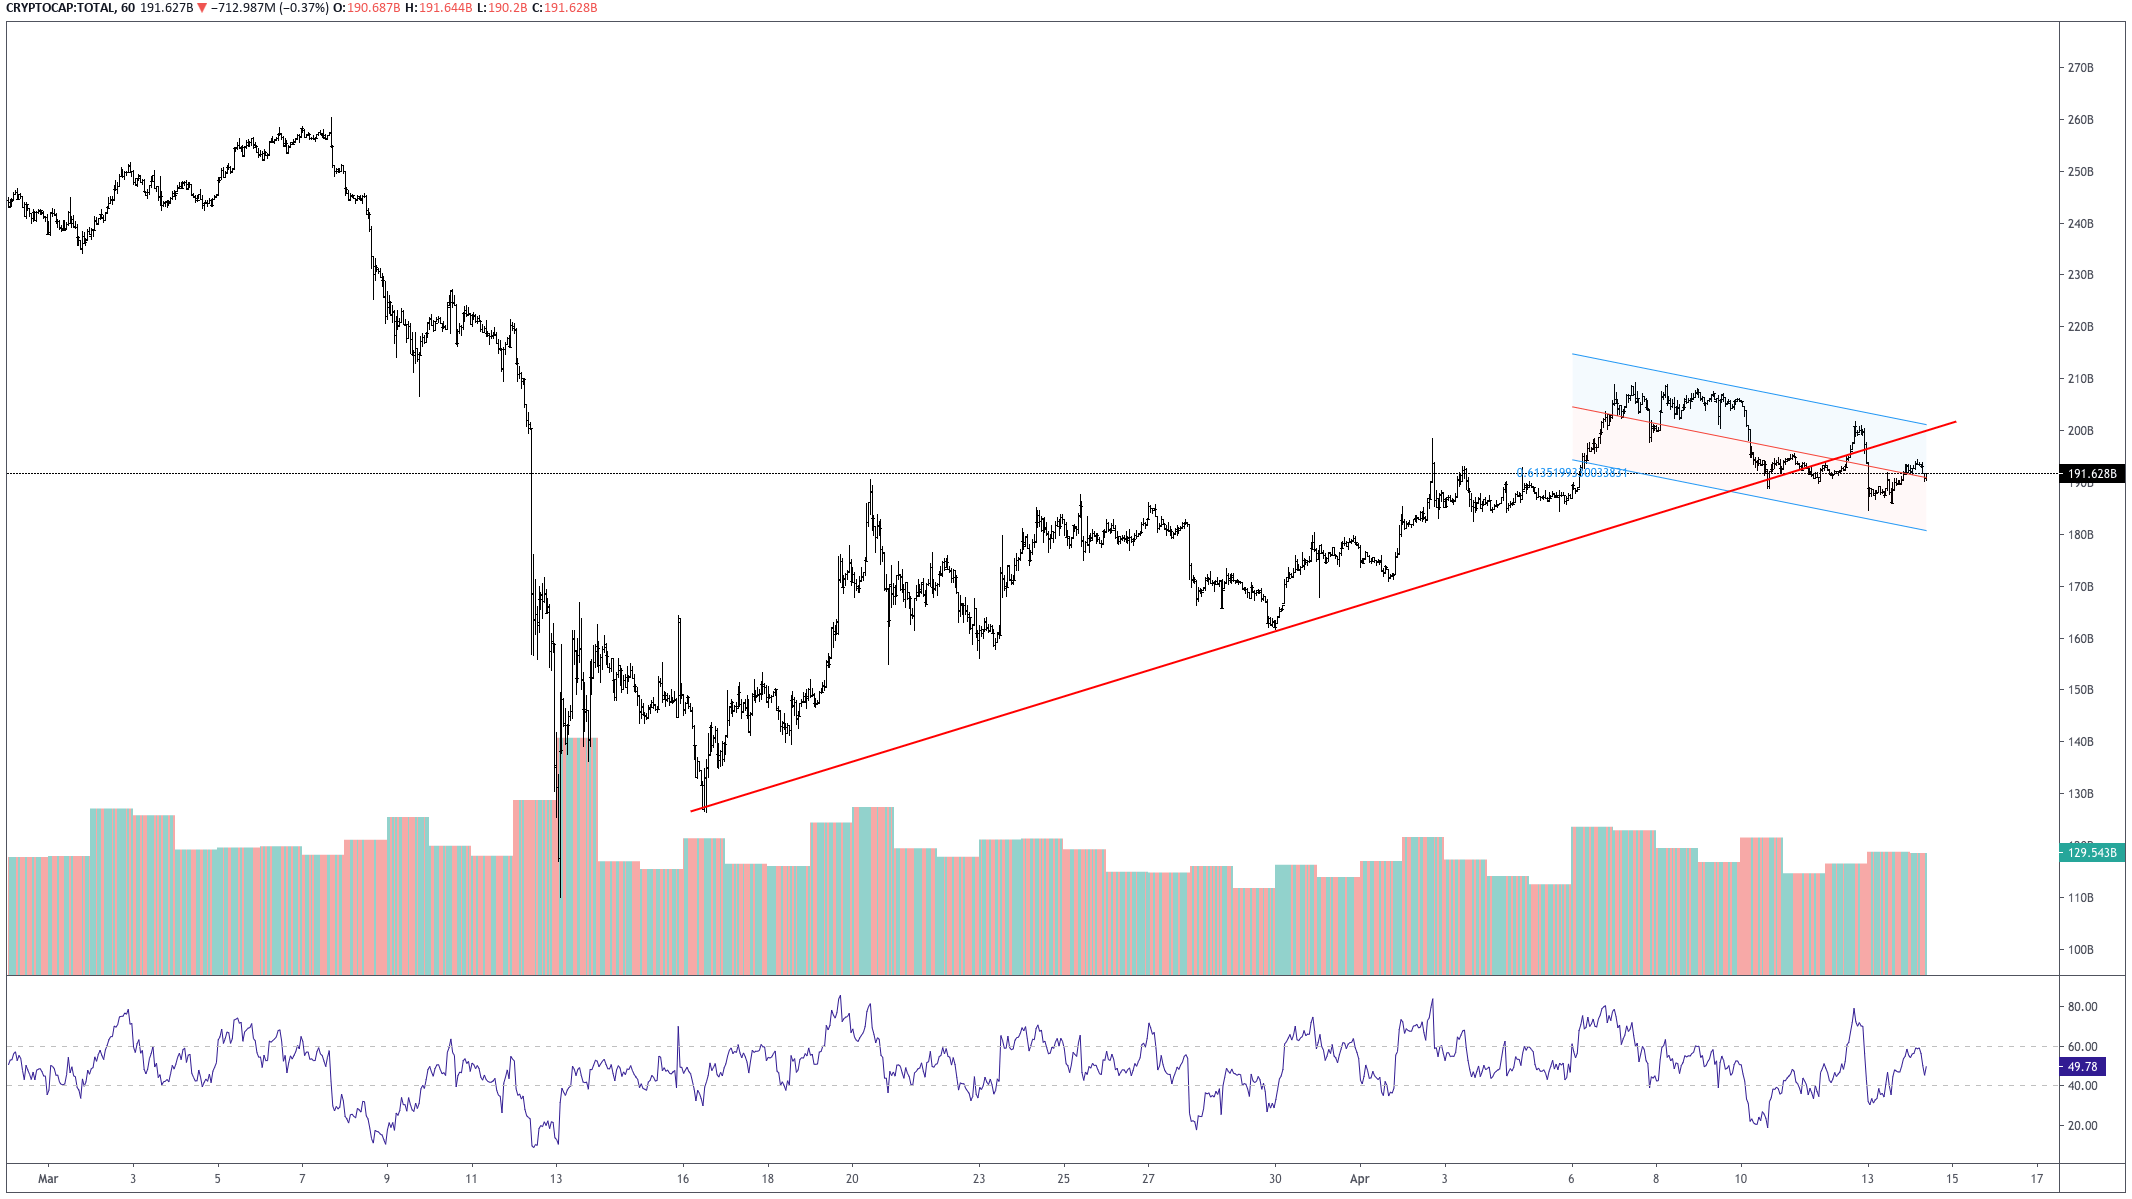
The chart above shows that the total market cap Linear Regression Channel moves in a slightly descending path, confirming the reactive nature of this trend. We see also that the upward trendline has been pierced, creating doubts about the fate of the previous upward trend.
Hot News
Binance tries to increase its markets in India and Indonesia. In a publication issued today, Binance announces that its users are now able to trade cryptocurrencies peer-to-peer using Indian Rupees and Indonesian Rupiah against BTC, ETH, BNB, USDT, and BUSD.
The Chinese government has set up a committee for the development of standards for Blockchain and Digital Ledger Technologies in general. That information was released in an official notice issued on Monday 13. It came three days after the Ministry of Industry and Information Technology, asking for feedback on standardizing data security in Blockchain.
According to a report by AmbCrupto published today, the information gathered from the Options’ open interest figures shows a potential bearish continuation for bitcoin and cryptos. In that report, we can see that the put open interest is increasing, and currently, the BTC put/call ratio is about 0.7, meaning more the selling pressure is growing.
Technical Analysis – Bitcoin
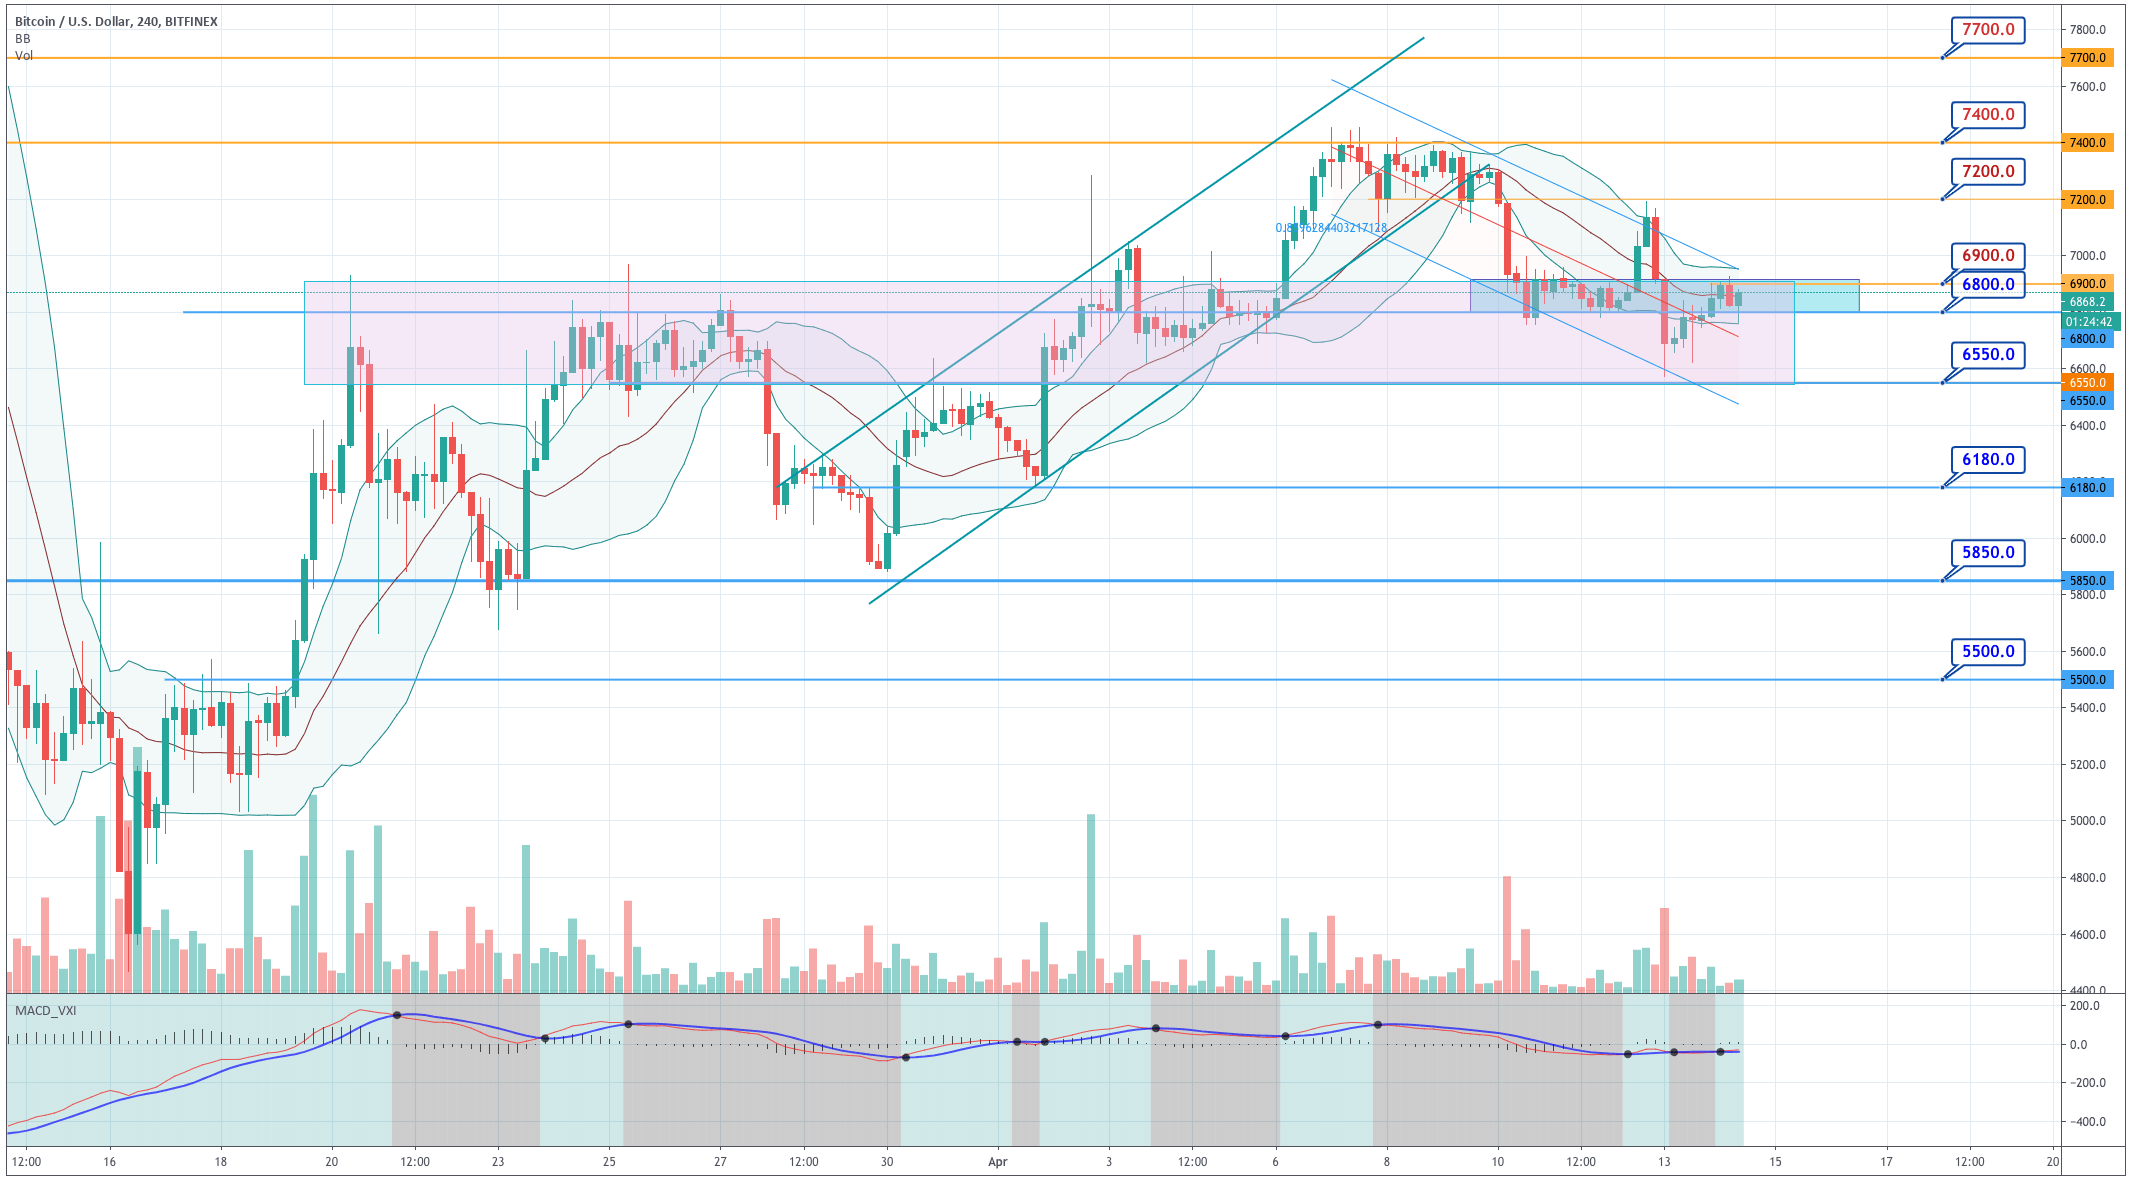
Bitcoin has retraced the last large bearish candle made on Monday after bouncing off from the $6,550 support. Now we see it retracing from the $6,900 level. The 4H chart shows that the price in an area of previous consolidations; thus, we can expect a choppy action in there. We also see the activity very near the mid-Bollinger line and the Bollinger bands shrinking, which confirms our previous assumption that the price will move sideways, possibly in a tight range between $6,800 and $6,900. Buyers should keep an eye on a breakout of the $6,900 level, whereas sellers should watch the breakdown of the $6,800 level.
Standard Pivot Point Levels
|
Support |
Pivot Point |
Resistance |
|
6,634 |
7,036
|
7,333 |
|
6,350 |
7,740 |
|
|
5,922 |
8,030 |
Ethereum
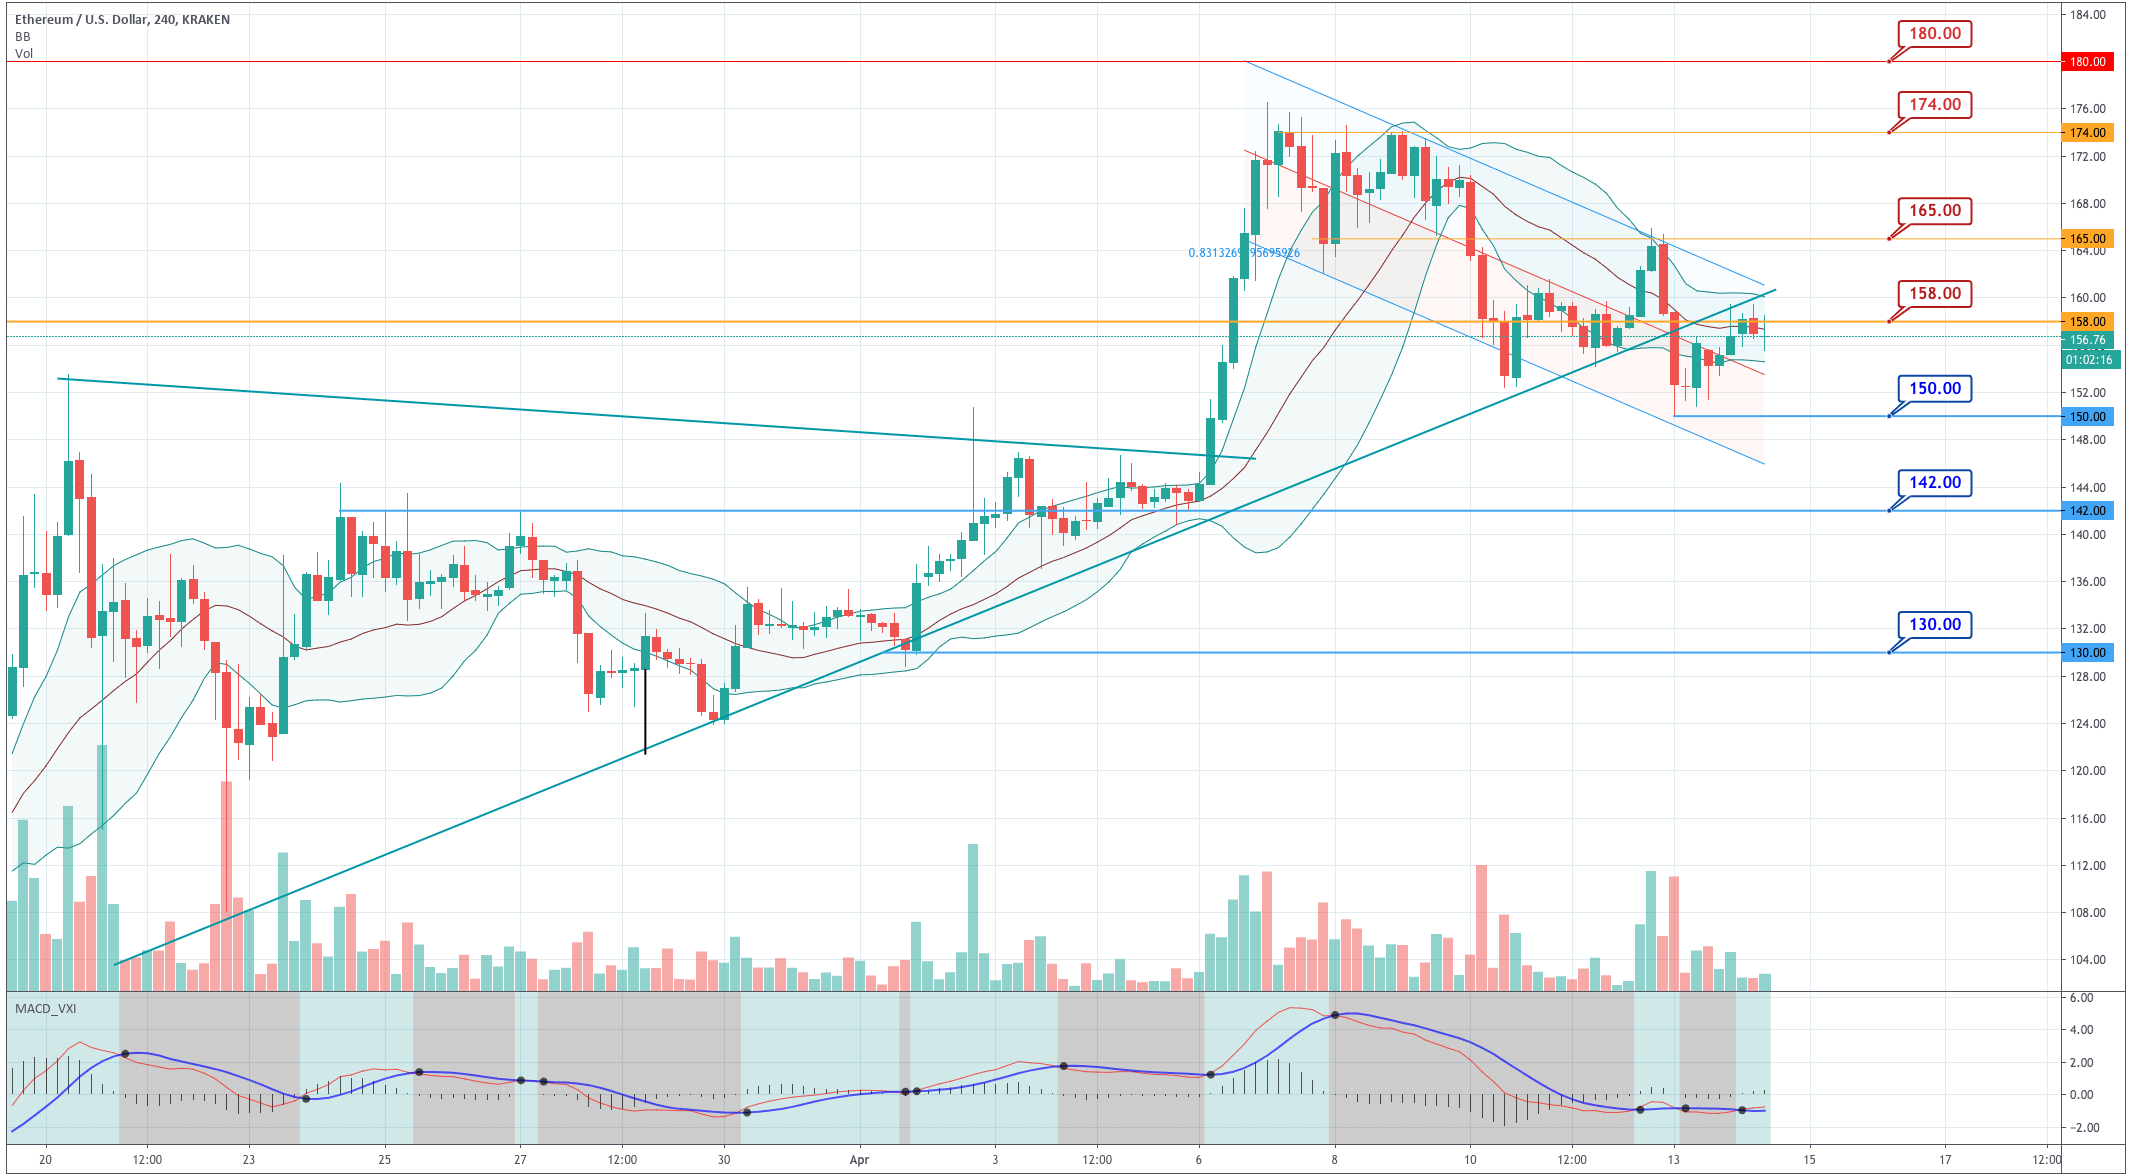
Ethereum’s linear regression channel is slightly bearish. We see also that the price has broken the ascending trendline, which is acting now as resistance.
The price of ETH has moved back to the previous consolidation level after both bounces, up and down, made during the weekend, and on Monday’s early morning. We see that it also moves near the mid-Bollinger line, and the Bollinger Bands are shrinking and pointing to a horizontal movement. The MACD also shows no action, just horizontal bias. Thus, ETH is likely moving sideways for a while. Sellers should watch breakouts of the $160 level, whereas sellers must eye the $154 level.
Standard Pivot Point Levels
|
Support |
Pivot Point |
Resistance |
|
142 |
160
|
175 |
|
125 |
193 |
|
|
107 |
209 |
Ripple
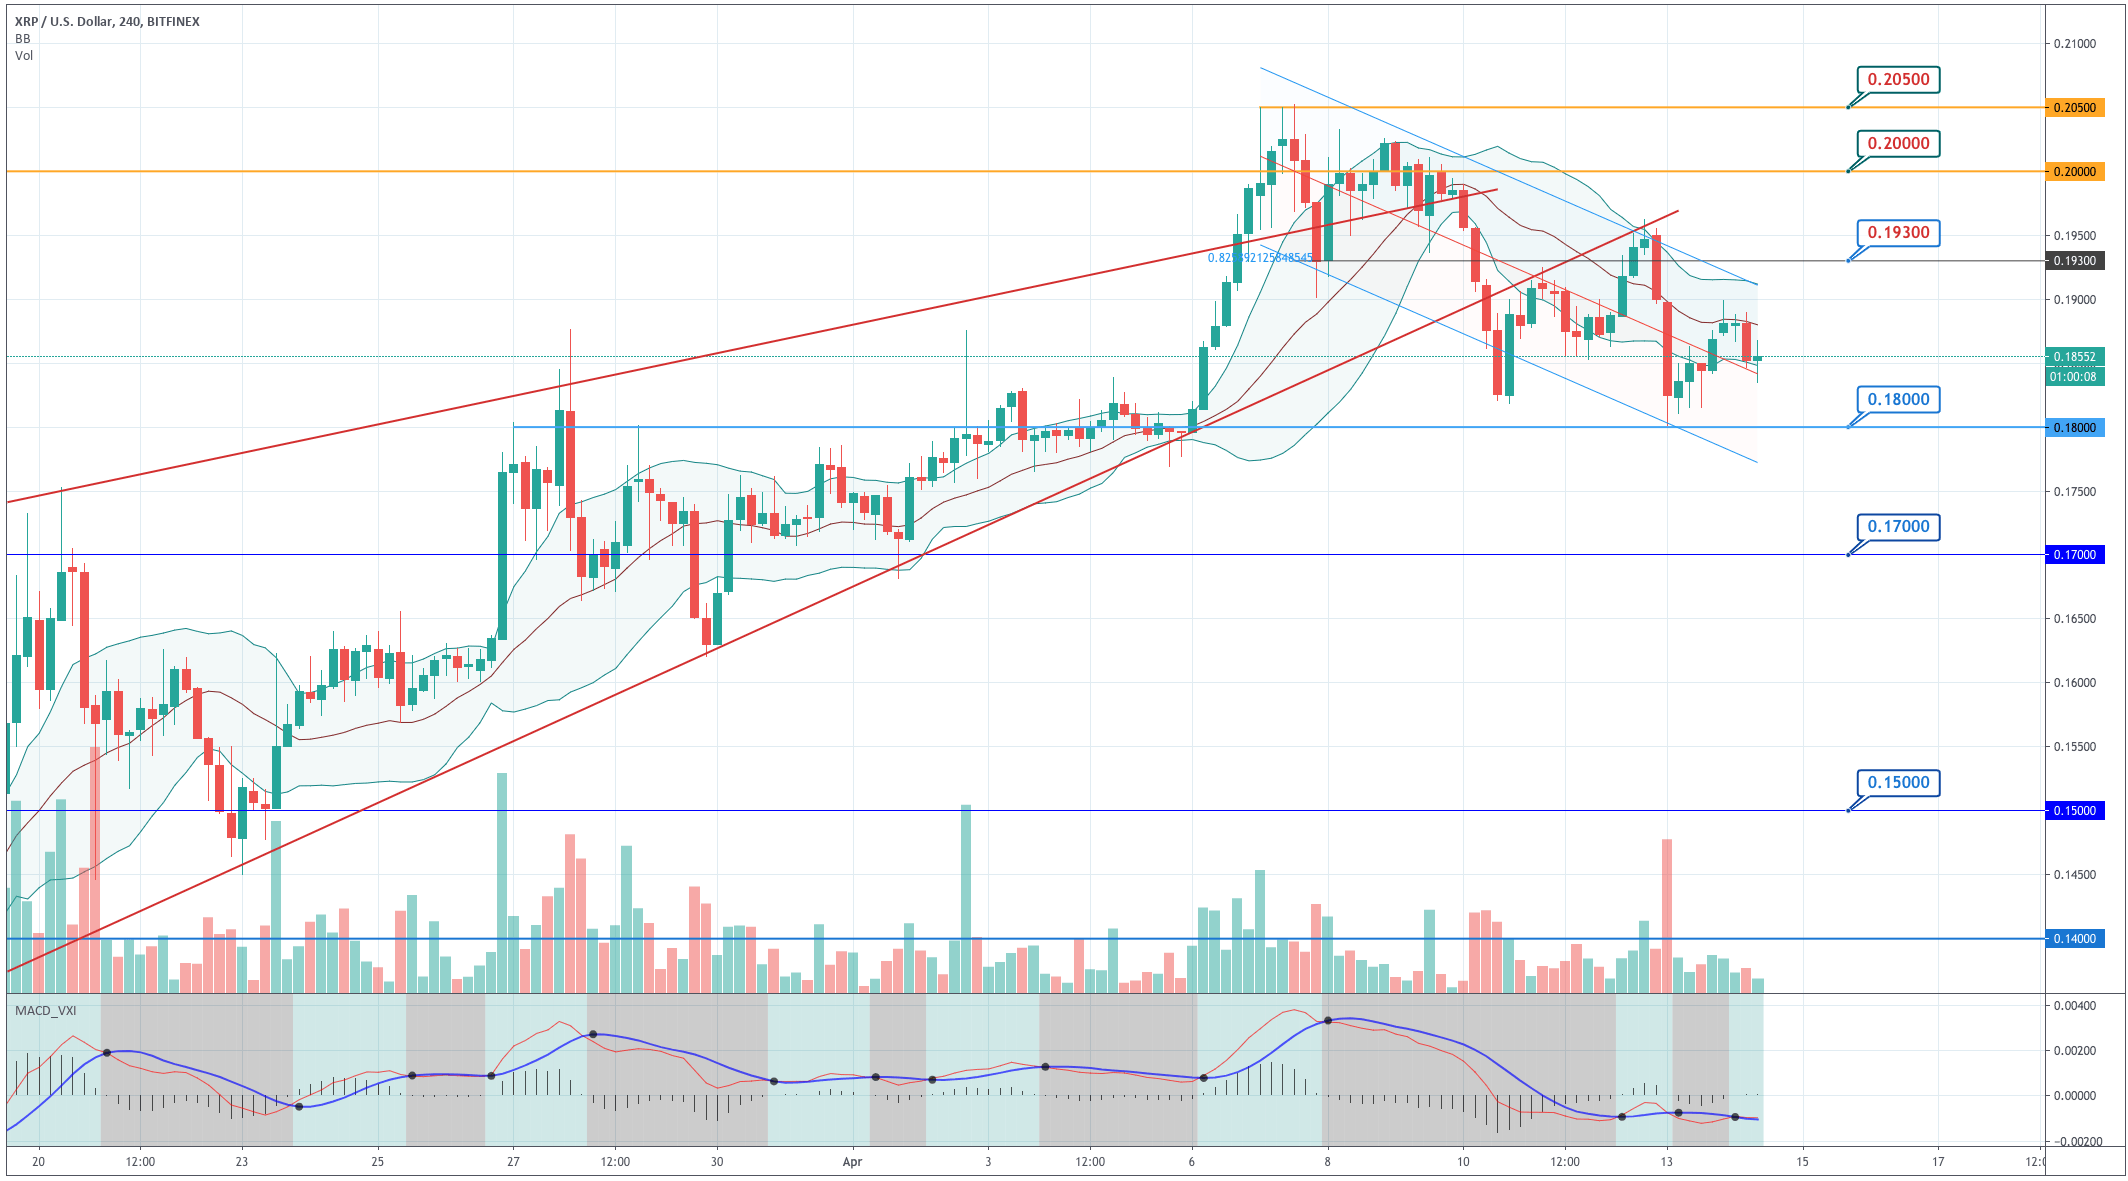
Ripple moves inside a descending channel. XRP’s price is currently moving near the -1SD line and the MACD moves in negative territory. That shows this asset is slightly more bearish than BTC and ETH. After the bounce made on Monday, the chart shows a kind of morning star formation that is also pointing to a bearish continuation. That means that if the crypto market starts being sold, Ripple will suffer more than the other two assets covered here. The best strategy for day traders is to fade the bullish candles. The $0.19 level, the level at which the price was rejected today, should be watched by buyers, but just if the overall crypto market starts moving with strength. Otherwise, it is a good place for shorts.
Standard Pivot Point Levels
|
Support |
Pivot Point |
Resistance |
|
0.1770 |
0.1920
|
0.2040 |
|
0.1650 |
0.2180 |
|
|
0.1500 |
0.2300 |


